

Overview
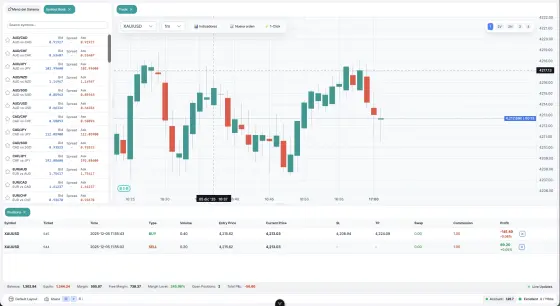
@pipsend/charts is a financial charting library for web applications, written in TypeScript and rendered on HTML canvas. It is framework-agnostic: you can use it from vanilla JavaScript, React, Vue, Angular, Svelte, or any other environment that gives you a DOM element.
It is built on top of TradingView's Lightweight Charts and adds a trading-oriented layer:
- Series types: candlestick, bar (OHLC), line, area, baseline, histogram, and custom series, plus a Heikin Ashi transform.
- 23 technical indicators applied with one function call each (SMA, EMA, RSI, MACD, Bollinger Bands, Ichimoku, VWAP and more). They recalculate on their own when the source data changes.
- Interactive drawing tools: position, ruler, Fibonacci, lines, channels, shapes, brush, and text, managed by a
DrawingToolsManagerwith selection, undo/redo and keyboard shortcuts. - Trading features: draggable price lines (stop loss, take profit, entry), position lines with P&L labels, trade markers, and click-to-create lines.
- Serialization: every drawing tool can be saved to plain JSON and restored, which enables chart templates and cross-device sync.
- Theming: colors, grid, crosshair, fonts and time zone are all configurable at runtime.
Package details (from package.json):
| Package | @pipsend/charts |
| Version documented here | 2.5.0 |
| Module format | ES module (type: "module"), with a standalone IIFE build for <script> tags |
| Types | Bundled (dist/typings.d.ts) |
| Runtime dependency | fancy-canvas |
Installation
Package managers
# npm
npm install @pipsend/charts

# yarn
yarn add @pipsend/charts

# pnpm
pnpm add @pipsend/charts

# bun
bun add @pipsend/charts
CDN
The standalone builds bundle their dependencies and expose everything on a global PipsendCharts object (a LightweightCharts alias to the same object is also provided for backward compatibility).
<!-- Production (Minified) -->
<script src="https://unpkg.com/@pipsend/charts/dist/pipsend-charts.standalone.production.js"></script>

<!-- Development (with warnings) -->
<script src="https://unpkg.com/@pipsend/charts/dist/pipsend-charts.standalone.development.js"></script>
Build variants
| Dependencies bundled | Mode | ES module | IIFE |
|---|---|---|---|
| No | Production | pipsend-charts.production.mjs |
N/A |
| No | Development | pipsend-charts.development.mjs |
N/A |
| Yes | Production | pipsend-charts.standalone.production.mjs |
pipsend-charts.standalone.production.js |
| Yes | Development | pipsend-charts.standalone.development.mjs |
pipsend-charts.standalone.development.js |
Use the production build in production. The package exports map resolves to it by default.
Requirements
- A modern browser with ES2015+ and the Canvas API. The README lists these minimum versions: Chrome 63+, Firefox 67+, Safari 11.1+, Edge 79+, Opera 50+, iOS Safari 11.3+, Chrome Android 63+.
- Node.js 22.3 or newer is declared in
enginesfor building the library from source. - Charts need a browser environment (canvas). In server-rendered frameworks, create the chart on the client only (see Framework integration).
Quick start
Basic candlestick chart
import { createChart, CandlestickSeries } from '@pipsend/charts';

const chart = createChart(document.getElementById('chart'), {
    width: 800,
    height: 600
});

const candleSeries = chart.addSeries(CandlestickSeries, {
    upColor: '#26a69a',
    downColor: '#ef5350'
});

candleSeries.setData([
    { time: '2024-01-01', open: 100, high: 105, low: 95, close: 102 },
    { time: '2024-01-02', open: 102, high: 108, low: 100, close: 106 },
]);
Adding technical indicators
Indicators take the series first and the chart second: apply<Name>(series, chart, options?).
import {
    createChart,
    CandlestickSeries,
    applySMA,
    applyRSI,
    applyMACD
} from '@pipsend/charts';

const chart = createChart(document.getElementById('chart'));
const series = chart.addSeries(CandlestickSeries);
series.setData(historicalData);

// Add SMA (Simple Moving Average) - appears on main chart
applySMA(series, chart, { period: 20, color: '#2196F3' });

// Add RSI - appears in separate panel
applyRSI(series, chart, { period: 14, color: '#9C27B0' });

// Add MACD - appears in separate panel
applyMACD(series, chart, {
    fastPeriod: 12,
    slowPeriod: 26,
    signalPeriod: 9
});
Interactive trading lines
import {
    createTradingLine,
    createInteractiveLineManager,
    LineStyle
} from '@pipsend/charts';

// Stop Loss (draggable by default)
const stopLoss = createTradingLine(series, chart, {
    price: 95.00,
    type: 'stop-loss',
    onDragEnd: (price) => {
        console.log('Stop Loss updated:', price);
        // Update your order in backend
    }
});

// Take Profit (draggable by default)
const takeProfit = createTradingLine(series, chart, {
    price: 110.00,
    type: 'take-profit',
    onDragEnd: (price) => console.log('TP:', price)
});

// Price Alert - Fully customizable
const alert = createTradingLine(series, chart, {
    price: 100.00,
    title: 'Price Alert',
    color: '#FFC107',
    lineStyle: LineStyle.Dotted,
    onDragEnd: (price) => api.updateAlert(price)
});

// Click-to-create: Create lines by clicking on chart
const manager = createInteractiveLineManager(chart, series);

document.getElementById('btnSL').onclick = async () => {
    await manager.enableClickToCreate('stop-loss');
};
Using the standalone build from a script tag
<div id="chart" style="width: 100%; height: 600px;"></div>
<script src="https://unpkg.com/@pipsend/charts/dist/pipsend-charts.standalone.production.js"></script>
<script>
    const chart = PipsendCharts.createChart(document.getElementById('chart'), {
        height: 600,
        layout: { background: { color: '#ffffff' }, textColor: '#333' },
        timeScale: { timeVisible: true, secondsVisible: false },
    });

    const series = chart.addSeries(PipsendCharts.CandlestickSeries, {
        upColor: '#26a69a',
        downColor: '#ef5350',
    });
    series.setData(candles);
    chart.timeScale().fitContent();
</script>
Creating a chart
import { createChart } from '@pipsend/charts';

const chart = createChart(container: string | HTMLElement, options?: DeepPartial<ChartOptions>);
container is an element or an element ID. options is any subset of the chart options and can be changed later with chart.applyOptions(...). The container needs explicit dimensions (or set autoSize: true and size the container with CSS).
const chart = createChart(document.getElementById('chart'), {
    width: 800,
    height: 600,
    layout: {
        background: { color: '#1E222D' },
        textColor: '#DDD',
    },
    grid: {
        vertLines: { color: '#2B2B43' },
        horzLines: { color: '#363C4E' },
    },
});
Main option groups and defaults
| Option | Default | Purpose |
|---|---|---|
width, height |
0 |
Chart size in pixels. 0 means not set. |
autoSize |
false |
Resize the chart with its container. |
addDefaultPane |
true |
Create the first pane automatically. |
layout.background |
{ type: ColorType.Solid, color: '#FFFFFF' } |
Chart background. |
layout.textColor |
'#191919' |
Axis and label text color. |
layout.fontSize |
12 |
Font size. |
layout.panes.enableResize |
true |
Let users drag pane separators. |
layout.attributionLogo |
true |
Shows the Pipsend logo in the bottom-left corner, linking to pipsend.com. |
grid.vertLines, grid.horzLines |
{ color: '#D6DCDE', style: LineStyle.Solid, visible: true } |
Grid lines. |
crosshair.mode |
CrosshairMode.Magnet |
Also Normal, Hidden, MagnetOHLC. |
rightPriceScale |
visible | Right price axis options. |
leftPriceScale |
hidden | Left price axis options. |
timeScale |
see Time scale | Horizontal axis options. |
localization.locale |
navigator.language |
Locale for labels. |
localization.dateFormat |
"dd MMM 'yy" |
Date format. |
localization.timeZone |
not set | IANA time zone, for example 'America/New_York'. |
handleScroll |
all true (mouseWheel, pressedMouseMove, horzTouchDrag, vertTouchDrag) |
Scroll interactions. |
handleScale |
all true (axisPressedMouseMove, axisDoubleClickReset, mouseWheel, pinch) |
Zoom interactions. |
kineticScroll |
{ mouse: false, touch: true } |
Inertial scrolling. |
Chart API
| Method | Description |
|---|---|
chart.addSeries(definition, options?, paneIndex?) |
Add a series. |
chart.addCustomSeries(paneView, options?) |
Add a custom series. |
chart.removeSeries(series) |
Remove a series. |
chart.applyOptions(options) / chart.options() |
Change or read chart options. |
chart.timeScale() |
Time scale API. |
chart.priceScale(id, paneIndex?) |
Price scale API. |
chart.addPane(), chart.panes(), chart.removePane(i), chart.swapPanes(a, b) |
Pane management. |
chart.resize(width, height, forceRepaint?) |
Resize manually. |
chart.takeScreenshot(addTopLayer?, includeCrosshair?) |
Returns an HTMLCanvasElement. |
chart.subscribeClick(handler), subscribeDblClick, subscribeCrosshairMove |
Mouse events (each has an unsubscribe* counterpart). |
chart.setCrosshairPosition(price, time, series) / chart.clearCrosshairPosition() |
Move the crosshair programmatically. |
chart.chartElement() |
The root DOM element. |
chart.remove() |
Destroy the chart and release resources. |
The library also exports version(), which returns the library version as a string.
Chart types and series
Every series is added with chart.addSeries(<Definition>, options?, paneIndex?).
| Series | Import | Data shape | Use |
|---|---|---|---|
| Candlestick | CandlestickSeries |
{ time, open, high, low, close } |
OHLC price. The default for trading. |
| Bar (OHLC) | BarSeries |
{ time, open, high, low, close } |
OHLC price, denser than candles. |
| Line | LineSeries |
{ time, value } |
One value per time: closes, indicators. |
| Area | AreaSeries |
{ time, value } |
Like Line, with a gradient fill. |
| Baseline | BaselineSeries |
{ time, value } |
A value colored by whether it is above or below a level. |
| Histogram | HistogramSeries |
{ time, value, color? } |
Vertical bars: volume, MACD. |
| Custom | chart.addCustomSeries(paneView) |
your own | Renderers the library does not ship. |
Heikin Ashi is not a series type. It is a transform applied on top of a candlestick or bar series (see Heikin Ashi).
Time values
The time field accepts three forms. Use only one form within a series.
1529899200                       // UTCTimestamp: UNIX seconds (not milliseconds)
'2021-02-03'                     // ISO business-day string
{ year: 2021, month: 2, day: 3 } // BusinessDay
Loading and updating data
| Method | When to use it |
|---|---|
series.setData(array) |
Initial load or full replacement of the history. |
series.update(point) |
A new tick: updates the last bar or appends a new one. |
series.update(point, true) |
Correct a bar that is already in the past (historicalUpdate). |
series.data() |
Read what the series currently holds. |
series.pop(n) |
Remove the last n points. |
Data rules
These apply to every series type:
- Points must be in ascending time order.
- Times must be unique. Two points with the same
timeare an error, not a replacement. - Use one time form per series (timestamps or business days, not mixed).
- Timestamps are in seconds, not milliseconds (
Date.now() / 1000). update()only moves forward: the last bar or a new one. Useupdate(point, true)to touch history.- If two series share an axis, fill the times one of them is missing with whitespace points.
Whitespace (gaps)
A point with only time and no value reserves space on the axis without drawing anything. It is useful for holidays, session gaps, or aligning series of different lengths.
series.setData([
    { time: '2024-01-02', value: 27.02 },
    { time: '2024-01-03' },              // gap
    { time: '2024-01-04', value: 23.92 }
]);
Options shared by all series
| Option | Default | Purpose |
|---|---|---|
visible |
true |
Hides the whole series, including labels and markers. |
title |
'' |
Name shown on the axis label. |
priceScaleId |
'right' |
Which scale the series lives on. '' makes it an overlay. |
priceFormat |
{ type: 'price', precision: 2, minMove: 0.01 } |
How prices are formatted. |
lastValueVisible |
true |
Last value label on the axis. |
priceLineVisible |
true |
Dashed horizontal line at the last price. |
priceLineColor, priceLineWidth, priceLineStyle |
'', 1, LineStyle.Dashed |
Style of that line. |
baseLineVisible |
true |
Base line. |
autoscaleInfoProvider |
none | Custom vertical range instead of the automatic one. |
Change them at runtime with series.applyOptions({ ... }) and read them with series.options().
priceFormat.type can be 'price', 'volume', 'percent' or 'custom' (with your own formatter):
series.applyOptions({
    priceFormat: { type: 'price', precision: 5, minMove: 0.00001 }  // FX
});
Candlestick
import { CandlestickSeries } from '@pipsend/charts';

const series = chart.addSeries(CandlestickSeries, {
    upColor: '#26a69a',
    downColor: '#ef5350',
    borderVisible: true,
    borderUpColor: '#26a69a',
    borderDownColor: '#ef5350',
    wickVisible: true,
    wickUpColor: '#26a69a',
    wickDownColor: '#ef5350'
});

series.setData([
    { time: '2024-01-02', open: 100, high: 105, low: 99, close: 104 },
    { time: '2024-01-03', open: 104, high: 108, low: 103, close: 106 }
]);
Defaults: upColor '#26a69a', downColor '#ef5350', wickVisible true, borderVisible true, border and wick colors matching up/down colors.
borderColor and wickColor also exist and override the up/down pairs when set, which is useful for a theme where all wicks are the same gray.
Color per candle. Any point can carry its own color, borderColor and wickColor, which win over the series options. Use it to mark specific bars without creating another series:
{ time: '2024-01-04', open: 106, high: 110, low: 105, close: 109, color: '#ffb300' }
Bar (OHLC)
The same information as candlesticks, drawn as bars with ticks. It takes less width, so it works better with many bars on screen.
import { BarSeries } from '@pipsend/charts';

const series = chart.addSeries(BarSeries, {
    upColor: '#26a69a',
    downColor: '#ef5350',
    openVisible: true,   // the left tick (open)
    thinBars: true       // 1px bars instead of scaled ones
});
The data is the same as for candlesticks, and each bar accepts its own color.
Line
import { LineSeries, LineStyle, LineType } from '@pipsend/charts';

const series = chart.addSeries(LineSeries, {
    color: '#2196f3',
    lineWidth: 2,               // only 1 | 2 | 3 | 4
    lineStyle: LineStyle.Solid, // Solid, Dotted, Dashed, LargeDashed, SparseDotted
    lineType: LineType.Simple,  // Simple, WithSteps, Curved
    lineVisible: true,
    pointMarkersVisible: false
});

series.setData([
    { time: '2024-01-02', value: 104 },
    { time: '2024-01-03', value: 106 }
]);
Common requests:
- Steps (rates, levels that change abruptly):
lineType: LineType.WithSteps. - Smooth curve:
lineType: LineType.Curved. - Visible points on sparse series:
pointMarkersVisible: true, optionallypointMarkersRadius. - Different colors per segment: set
colorper point. A point's color paints the segment that leaves it toward the next point, so to tint a segment, color its first point.
The marker under the crosshair is controlled by crosshairMarkerVisible, crosshairMarkerRadius, crosshairMarkerBorderColor, crosshairMarkerBackgroundColor and crosshairMarkerBorderWidth.
Area
Line with a gradient fill down to the pane edge. Use it to show magnitude, not to compare several overlapping series (the fills cover each other).
import { AreaSeries } from '@pipsend/charts';

const series = chart.addSeries(AreaSeries, {
    lineColor: '#33D778',
    topColor: 'rgba(46, 220, 135, 0.4)',
    bottomColor: 'rgba(40, 221, 100, 0)',
    lineWidth: 2
});
| Option | Purpose |
|---|---|
relativeGradient |
Measures the gradient against the visible range instead of the pane. |
invertFilledArea |
Fills upward instead of downward. |
Area inherits the line options. Each point can carry its own lineColor, topColor and bottomColor.
Baseline
A value painted one color above a level and another below it. It suits P&L, performance against an entry price, or anything where the sign matters.
import { BaselineSeries } from '@pipsend/charts';

const series = chart.addSeries(BaselineSeries, {
    baseValue: { type: 'price', price: 100 },   // the cut-off level
    topLineColor: 'rgba(38, 166, 154, 1)',
    topFillColor1: 'rgba(38, 166, 154, 0.28)',
    topFillColor2: 'rgba(38, 166, 154, 0.05)',
    bottomLineColor: 'rgba(239, 83, 80, 1)',
    bottomFillColor1: 'rgba(239, 83, 80, 0.05)',
    bottomFillColor2: 'rgba(239, 83, 80, 0.28)'
});
baseValue is { type: 'price', price: <number> } and defaults to 0. If you do not set it to a real price, everything is painted in the "top" color. This is the most common mistake with this series. topFillColor1 and topFillColor2 are the two ends of the upper gradient (1 next to the line, 2 away from it); the same applies below.
Histogram
Vertical bars from a base. Use it for volume, MACD, or anything discrete.
import { HistogramSeries } from '@pipsend/charts';

const series = chart.addSeries(HistogramSeries, {
    color: '#26a69a',
    base: 0,                          // where the bars grow from
    priceFormat: { type: 'volume' }   // formats 1.2M instead of 1200000.00
});

series.setData([
    { time: '2024-01-02', value: 1_200_000, color: '#26a69a' },
    { time: '2024-01-03', value:   900_000, color: '#ef5350' }
]);
Color is per bar, not per series. That is the mechanism for painting volume green or red according to the candle direction. For MACD, base: 0 with negative values draws the bars downward automatically. For volume specifically, see the Volume indicator.
Custom series
For types the library does not ship (Renko, Kagi, Point and Figure), implement an ICustomSeriesPaneView and register it:
const series = chart.addCustomSeries(myPaneView, { color: '#2196f3' });
The pane view must implement:
| Method | Responsibility |
|---|---|
renderer() |
Returns the object that draws on the canvas. |
update(data, options) |
Receives new data and options before each draw. |
priceValueBuilder(plotRow) |
Which prices of each point take part in autoscale. |
isWhitespace(data) |
Tells a real point from a gap. |
defaultOptions() |
The series' default options. |
Renko and Kagi also change the time axis (one bar is not one period), so plan the time mapping before writing the renderer.
Heikin Ashi
Heikin Ashi is a transform of the OHLC bars. Each candle averages with the previous one, which removes much of the bar-to-bar noise.
close = (O + H + L + C) / 4
open  = (previous open + previous close) / 2      // first bar: (O + C) / 2
high  = max(H, open, close)
low   = min(L, open, close)
Apply it on an existing candlestick or bar series:
import { createChart, CandlestickSeries, applyHeikinAshi } from '@pipsend/charts';

const series = chart.addSeries(CandlestickSeries);
series.setData(bars);

const ha = applyHeikinAshi(series, chart);

// Back to regular candles
ha.remove();
The source series keeps its real prices and is only painted transparent, not hidden. This means:
- Indicators bound to it keep computing on the true OHLC.
- Its price lines and primitives (positions, alerts, drawings) stay on screen.
remove()restores the chart exactly as it was.- New bars pushed to the source are transformed automatically.
This makes it usable as a chart-type toggle in a toolbar. (visible: false would not work for this, because it also turns off everything attached to the series.)
Colors and behavior can be configured:
applyHeikinAshi(series, chart, {
    upColor: '#26a69a',
    downColor: '#ef5350',
    borderVisible: true,
    wickVisible: true,
    hideSource: true,   // set false to draw over the raw candles
    paneIndex: 0
});
It returns the standard indicator handle (see Indicators): series, applyOptions(), options(), recalculate() and remove().
If you only want the numbers, use the pure function:
import { calculateHeikinAshi } from '@pipsend/charts';

const haBars = calculateHeikinAshi(bars);
Whitespace points pass through unchanged and do not carry the average. Each Heikin Ashi bar folds in the one before it, so the result depends on where the data starts. Pass the whole series rather than a recent window when you can; the difference decays over a few bars.
Recipes
Switching chart type. There is no setType(), and deleting a series to create another orphans everything attached to it (indicators, price lines, drawings). The approach that works is a source series that is never destroyed, with a view on top, as Heikin Ashi does:
import { LineSeries, hideSeriesPaint } from '@pipsend/charts';

// The source (candles) keeps the real OHLC and everything attached to it.
const restore = hideSeriesPaint(source);
const view = chart.addSeries(LineSeries);
view.setData(bars.map(b => ({ time: b.time, value: b.close })));

// Back to candles:
chart.removeSeries(view);
restore();
hideSeriesPaint() paints the series transparent and turns off its last-price label, but leaves it visible to the engine, so its price lines and primitives stay on screen. It returns the function that puts the paint back. Push ticks to both series, because the view does not listen to the source. Line, Area and Baseline need { time, value }, not OHLC.
Volume under the price, same pane. A series with priceScaleId: '' lives on its own invisible overlay scale. Use scaleMargins to push it to the bottom:
const volume = chart.addSeries(HistogramSeries, {
    priceFormat: { type: 'volume' },
    priceScaleId: ''
});

chart.priceScale('', 0).applyOptions({
    scaleMargins: { top: 0.8, bottom: 0 }   // uses the lower 20%
});
Separate panes. The third argument of addSeries is the pane index:
const rsi = chart.addSeries(LineSeries, { color: '#7e57c2' }, 1);
The engine does not leave gaps between panes. If you ask for pane 3 and only panes 0 and 1 exist, the series lands in pane 2, and configuring the scale with the index you asked for throws incorrect pane index. Ask the chart where the series ended up:
const pane = rsi.getPane().paneIndex();
chart.priceScale('right', pane).applyOptions({ /* ... */ });
Pane API: chart.addPane(), chart.panes(), chart.removePane(i), series.moveToPane(i), and per pane getHeight(), setHeight(), setStretchFactor().
Two series on the same scale. Pass the same priceScaleId. To compare instruments with very different prices, use separate scales ('right' and 'left') or normalize the values.
Real-time updates
Use series.update(point) for live data. setData() re-ingests the whole series, which is noticeable on a long history.
// Update the last bar, or append a new one if the time is newer
series.update({ time: Math.floor(Date.now() / 1000), open: 100, high: 105, low: 95, close: 102 });

// Correct a bar that is already in the past
series.update(correctedBar, true);
Indicators and Heikin Ashi recalculate on their own after setData() or update(), and on each tick only the last point is rewritten.
When ticks arrive faster than you need to paint, batch them. This example from the library README keeps only the latest tick of each 100 ms window:
let updateQueue = [];
let updateTimer = null;

function queueUpdate(newCandle) {
    updateQueue.push(newCandle);

    if (!updateTimer) {
        updateTimer = setTimeout(() => {
            series.update(updateQueue[updateQueue.length - 1]);
            updateQueue = [];
            updateTimer = null;
        }, 100); // Batch updates every 100ms
    }
}
Related options:
timeScale.shiftVisibleRangeOnNewBar(defaulttrue) scrolls the view when a new bar arrives.chart.timeScale().scrollToRealTime()jumps back to the latest bar.- A common error is
Cannot update oldest data:update()was called with a time earlier than the last bar. Useupdate(point, true)for history.
Time scale and price scale
Time scale
Get it with chart.timeScale(). Options go through chart.applyOptions({ timeScale: { ... } }) or chart.timeScale().applyOptions({ ... }).
const timeScale = chart.timeScale();

timeScale.fitContent();                          // fit all data
timeScale.scrollToRealTime();                    // jump to the latest bar
timeScale.setVisibleRange({ from: startTime, to: endTime });
const range = timeScale.getVisibleRange();

timeScale.subscribeVisibleTimeRangeChange((range) => console.log(range));
| Method | Description |
|---|---|
fitContent() |
Fit all data in view. |
scrollToRealTime() |
Scroll to the latest bar. |
scrollToPosition(position, animated), scrollPosition() |
Scroll by bars. |
getVisibleRange() / setVisibleRange(range) |
Visible time range. |
getVisibleLogicalRange() / setVisibleLogicalRange(range) |
Visible range by bar index. |
resetTimeScale() |
Reset zoom and scroll. |
timeToCoordinate(time), coordinateToTime(x), timeToIndex(time, findNearest?) |
Conversions. |
subscribeVisibleTimeRangeChange, subscribeVisibleLogicalRangeChange, subscribeSizeChange |
Events (with unsubscribe* counterparts). |
Time scale option defaults:
| Option | Default |
|---|---|
rightOffset |
0 |
barSpacing |
6 |
minBarSpacing |
0.5 |
maxBarSpacing |
0 (no limit) |
fixLeftEdge, fixRightEdge |
false |
lockVisibleTimeRangeOnResize |
false |
rightBarStaysOnScroll |
false |
borderVisible, borderColor |
true, '#2B2B43' |
visible |
true |
timeVisible |
false (set true for intraday data) |
secondsVisible |
true |
shiftVisibleRangeOnNewBar |
true |
ticksVisible |
false |
uniformDistribution |
false |
allowBoldLabels |
true |
Time zone. localization.timeZone (an IANA zone such as 'America/New_York') shows the chart's times in that zone, daylight saving included. Your data stays in UTC. The crosshair label and default tick labels are written in local time, and a day starts at local midnight even when no bar opens exactly on it. The helper timeZoneOffset(zone, time) is exported so custom formatters can do the same.
chart.applyOptions({ localization: { timeZone: 'America/New_York' } });
Tick mark filter. timeScale.tickMarkFilter(time, tickMarkType, barsPerMark, previousTime) lets you decide which times may carry a mark or grid line on the axis. Times it rejects never get a mark; the rest are spread by weight and zoom as usual. barsPerMark says how many bars must separate two marks at the current zoom, so the filter can choose the finest regular grid that fits.
Fixed text at the chart edge. createTimeLabels(series, labels, options) draws a row of text labels, each centered on the bar at its time, a few pixels from the bottom (or top) edge of the pane. They do not depend on price, so they stay in place however you move or zoom the price scale (for example, a row of weekday names). Each label is { time, text, color?, size? }; options are position ('bottom' or 'top', default 'bottom'), offset (4), fontSize (11), fontFamily and color ('#787B86'). setLabels replaces them all at once. Times that are not on the time scale are not drawn.
Price scale
Get it with chart.priceScale('right') (or 'left', or an overlay ID), optionally with a pane index, or from a series with series.priceScale().
chart.priceScale('right').applyOptions({
    scaleMargins: { top: 0.1, bottom: 0.2 },
    borderColor: '#2B2B43',
});
| Option | Default |
|---|---|
autoScale |
true |
mode |
PriceScaleMode.Normal (also Logarithmic, Percentage, IndexedTo100) |
invertScale |
false |
alignLabels |
true |
borderVisible, borderColor |
true, '#2B2B43' |
scaleMargins |
{ top: 0.2, bottom: 0.1 } |
ticksVisible |
false |
minimumWidth |
0 |
ensureEdgeTickMarksVisible |
false |
tickMarkSpacing |
2.5 |
tickMarkSpacing is the room each axis label reserves, as a multiple of the font height. Lower it to show more prices on the axis. Steps are discrete, so values between 1.2 and 2.0 usually land on the same one; the real changes happen around 2.5, 1.5 and 1.0.
Price scale API: applyOptions(), options(), width(), setVisibleRange(), getVisibleRange(), setAutoScale(on).
Series-level conversions: series.priceToCoordinate(price) and series.coordinateToPrice(y). Price lines: series.createPriceLine(options), series.removePriceLine(line), series.priceLines().
Indicators
The library ships 23 indicators. All apply* functions share one signature, with the series first and the chart second:
apply<Name>(series, chart, options?)
import { createChart, CandlestickSeries, applySMA } from '@pipsend/charts';

const chart = createChart(container);
const candles = chart.addSeries(CandlestickSeries);
candles.setData(bars);

const sma = applySMA(candles, chart, { period: 20, color: '#2196F3' });
The indicator handle
Each apply* call returns a handle with the series it created plus four methods, identical for all indicators:
| Method | What it does |
|---|---|
applyOptions(partial) |
Changes options on the fly. A color repaints; a period recalculates. |
options() |
The current options, with defaults resolved. |
recalculate() |
Forces a full recalculation. |
remove() |
Removes the series and cuts the subscription to the source series. |
sma.applyOptions({ period: 50, color: '#ff9800' });  // no destroy and recreate
sma.options().period;                                 // 50
sma.remove();
Call remove() when you are done with an indicator. Without it, the subscription outlives the indicator and keeps writing to series that no longer exist. Indicators recalculate by themselves when the source series changes; you do not need to call anything after setData() or update().
Series exposed by each indicator:
| Indicator | Exposed series |
|---|---|
| Bollinger, Keltner, Donchian | upper, middle, lower |
| MACD | macd, signal, histogram |
| Stochastic | k, d |
| ADX | adx, plusDI, minusDI |
| Ichimoku | conversion, base, spanA, spanB, lagging |
| VWAP | series, upper, lower |
| Pivot Points | pivot, resistances[], supports[] |
| All the rest | series |
Shared options
| Option | Type | Purpose |
|---|---|---|
paneIndex |
number |
Pane to draw in. Fixed at creation: applyOptions ignores it. |
lineWidth |
1 | 2 | 3 | 4 |
Line width. Other values do nothing. |
lineStyle |
0..4 |
0 solid, 1 dotted, 2 dashed, 3 large dashed, 4 sparse dotted. |
source |
IndicatorSource |
Which price of each bar is used. |
source accepts 'close', 'open', 'high', 'low', 'hl2', 'hlc3' and 'ohlc4', and is supported by SMA, EMA, WMA, RSI and Keltner. On a line series, which only has value, any source resolves to that value.
Indicators that need volume
A price series does not carry volume, so feed it separately, once for all of them:
import { setSeriesVolumes } from '@pipsend/charts';

setSeriesVolumes(candles, bars);   // bars: [{ time, volume }, ...]
Volume, OBV, MFI and VWAP need this call and draw nothing without it. Volume Profile has its own channel, setVolumeProfileData().
Overlay indicators (on the price pane)
All default to paneIndex: 0.
SMA (Simple Moving Average)
applySMA(series, chart, { period: 20, color: '#2196F3' });
| Option | Default |
|---|---|
period |
20 |
color |
'#2196F3' |
lineWidth |
2 |
source |
'close' |
lineStyle |
0 |
EMA (Exponential Moving Average)
applyEMA(series, chart, { period: 12, color: '#FF9800' });
| Option | Default |
|---|---|
period |
12 |
color |
'#FF9800' |
lineWidth |
2 |
source |
'close' |
lineStyle |
0 |
WMA (Weighted Moving Average)
applyWMA(series, chart, { period: 20 });
| Option | Default |
|---|---|
period |
20 |
color |
'#4CAF50' |
lineWidth |
2 |
source |
'close' |
lineStyle |
0 |
Bollinger Bands
const bb = applyBollingerBands(series, chart, { period: 20, stdDev: 2 });
bb.upper; bb.middle; bb.lower;
| Option | Default |
|---|---|
period |
20 |
stdDev |
2 |
colorUpper |
'#3F51B5' |
colorMiddle |
'#2196F3' |
colorLower |
'#3F51B5' |
lineWidth |
1 |
Keltner Channels
const kc = applyKeltnerChannels(series, chart, { period: 20, multiplier: 2 });
| Option | Default |
|---|---|
period |
20 |
atrPeriod |
10 |
multiplier |
2 |
source |
'close' |
colorUpper, colorLower |
'#787B86' |
colorMiddle |
'#2962FF' |
lineWidth |
1 |
lineStyle |
0 |
Donchian Channels
const dc = applyDonchianChannels(series, chart, { period: 20 });
| Option | Default |
|---|---|
period |
20 |
colorUpper |
'#089981' |
colorMiddle |
'#787B86' |
colorLower |
'#F23645' |
lineWidth |
1 |
lineStyle |
0 |
showMiddle |
true |
Parabolic SAR
applyParabolicSAR(series, chart, { step: 0.02, maxStep: 0.2 });
| Option | Default |
|---|---|
step |
0.02 |
maxStep |
0.2 |
colorUp |
'#089981' |
colorDown |
'#F23645' |
dotSize |
2 |
SuperTrend
applySuperTrend(series, chart, { period: 10, multiplier: 3 });
| Option | Default |
|---|---|
period |
10 |
multiplier |
3 |
colorUp |
'#089981' |
colorDown |
'#F23645' |
lineWidth |
2 |
VWAP
Needs volume data.
const vwap = applyVWAP(series, chart, { anchorPeriod: 'daily', bandMultiplier: 1 });
vwap.series; vwap.upper; vwap.lower;
| Option | Default |
|---|---|
anchorPeriod |
'daily' (also 'weekly', 'monthly') |
color |
'#2962FF' |
lineWidth |
2 |
lineStyle |
0 |
bandMultiplier |
0 (at 0, no bands are drawn) |
bandColor |
'#787B86' |
Ichimoku
The filled cloud and its projection beyond the last bar are drawn by a dedicated primitive, because the engine cannot do it natively.
const ich = applyIchimoku(series, chart);
ich.conversion; ich.base; ich.spanA; ich.spanB; ich.lagging;
| Option | Default |
|---|---|
conversionPeriod |
9 |
basePeriod |
26 |
spanBPeriod |
52 |
displacement |
26 |
colorConversion |
'#2962FF' |
colorBase |
'#F23645' |
colorSpanA |
'#089981' |
colorSpanB |
'#F23645' |
colorLagging |
'#787B86' |
cloudBullishColor |
'#089981' |
cloudBearishColor |
'#F23645' |
cloudOpacity |
0.15 |
showCloud, showLagging |
true |
lineWidth |
1 |
Pivot Points
const pp = applyPivotPoints(series, chart, { pivotPeriod: 'daily', levels: 3 });
pp.pivot; pp.resistances; pp.supports;   // the last two are arrays
| Option | Default |
|---|---|
pivotPeriod |
'daily' (also 'weekly', 'monthly') |
levels |
3 |
colorPivot |
'#FF6D00' |
colorResistance |
'#F23645' |
colorSupport |
'#089981' |
lineWidth |
1 |
lineStyle |
2 |
Panel indicators (separate panes)
Each one has its own default paneIndex. The engine leaves no gaps between panes, so a single indicator added alone lands in the first free pane, not necessarily at its default index (see Troubleshooting). Indicators resolve this internally. If you configure a scale yourself, ask where the series landed instead of assuming the requested index:
const pane = rsi.series.getPane().paneIndex();
chart.priceScale('right', pane).applyOptions({ /* ... */ });
RSI (default pane 1)
applyRSI(series, chart, { period: 14, overbought: 70, oversold: 30 });
| Option | Default |
|---|---|
period |
14 |
color |
'#9C27B0' |
lineWidth |
2 |
source |
'close' |
lineStyle |
0 |
overbought |
70 |
oversold |
30 |
levelColor |
'#787B86' |
The levels are drawn as dotted price lines on the pane.
MACD (default pane 2)
const macd = applyMACD(series, chart, { fastPeriod: 12, slowPeriod: 26, signalPeriod: 9 });
macd.macd; macd.signal; macd.histogram;
| Option | Default |
|---|---|
fastPeriod |
12 |
slowPeriod |
26 |
signalPeriod |
9 |
colorMACD |
'#2196F3' |
colorSignal |
'#FF6D00' |
colorHistogramUp |
'#26a69a' |
colorHistogramDown |
'#ef5350' |
lineWidth |
2 |
Volume (default pane 3)
Needs volume data.
applyVolume(series, chart, { colorUp: '#26a69a', colorDown: '#ef5350' });
| Option | Default |
|---|---|
colorUp |
'#26a69a' |
colorDown |
'#ef5350' |
Colors live on each bar, not on the series, so changing them triggers a recalculation rather than a repaint.
Stochastic (default pane 4)
const st = applyStochastic(series, chart, { kPeriod: 14, dPeriod: 3 });
st.k; st.d;
| Option | Default |
|---|---|
kPeriod |
14 |
dPeriod |
3 |
colorK |
'#2196F3' |
colorD |
'#FF6D00' |
lineWidth |
2 |
lineStyle |
0 |
overbought |
80 |
oversold |
20 |
levelColor |
'#787B86' |
OBV (default pane 5)
Needs volume data.
applyOBV(series, chart, { color: '#2196F3' });
| Option | Default |
|---|---|
color |
'#2196F3' |
lineWidth |
2 |
data |
none (optional: your own volumes) |
ATR (default pane 6)
applyATR(series, chart, { period: 14 });
| Option | Default |
|---|---|
period |
14 |
color |
'#FF9800' |
lineWidth |
2 |
ADX / DMI (default pane 7)
const adx = applyADX(series, chart, { period: 14, showDI: true });
adx.adx; adx.plusDI; adx.minusDI;
| Option | Default |
|---|---|
period |
14 |
colorADX |
'#F23645' |
colorPlusDI |
'#089981' |
colorMinusDI |
'#2962FF' |
lineWidth |
2 |
lineStyle |
0 |
threshold |
25 |
levelColor |
'#787B86' |
showDI |
true |
CCI (default pane 8)
applyCCI(series, chart, { period: 20 });
| Option | Default |
|---|---|
period |
20 |
color |
'#2962FF' |
lineWidth |
2 |
lineStyle |
0 |
overbought |
100 |
oversold |
-100 |
levelColor |
'#787B86' |
Williams %R (default pane 9)
The scale runs from 0 to -100, so the levels are negative.
applyWilliamsR(series, chart, { period: 14 });
| Option | Default |
|---|---|
period |
14 |
color |
'#FF6D00' |
lineWidth |
2 |
lineStyle |
0 |
overbought |
-20 |
oversold |
-80 |
levelColor |
'#787B86' |
MFI (default pane 10)
Needs volume data.
applyMFI(series, chart, { period: 14 });
| Option | Default |
|---|---|
period |
14 |
color |
'#9C27B0' |
lineWidth |
2 |
lineStyle |
0 |
overbought |
80 |
oversold |
20 |
levelColor |
'#787B86' |
Primitive-based indicators
These two do not create series. They paint on the pane through a primitive, so their signature is different: the chart goes first.
create<Name>(chart, series, options?)
Trading Sessions (Forex)
Shades the Tokyo, London and New York sessions and, optionally, their overlaps. Each session runs on its own city's clock and follows its daylight saving.
import { createTradingSessionsIndicator, DEFAULT_SESSIONS } from '@pipsend/charts';

const sessions = createTradingSessionsIndicator(chart, series, {
    sessions: DEFAULT_SESSIONS,
    showOverlaps: true,
    enabled: true
});

sessions.applyOptions({ enabled: false });
sessions.remove();
| Option | Default |
|---|---|
sessions |
DEFAULT_SESSIONS (see below) |
showOverlaps |
true |
overlapColor |
'#9C27B0' |
overlapOpacity |
0.15 |
enabled |
true (set false to switch it off without destroying it) |
DEFAULT_SESSIONS in the source code:
| Session | Hours (local) | Time zone | Color |
|---|---|---|---|
| Tokyo | 9 to 18 | Asia/Tokyo |
#FF6B00 |
| London | 8 to 17 | Europe/London |
#2962FF |
| New York | 8 to 17 | America/New_York |
#089981 |
Each TradingSession is { name, startHour, endHour, color, opacity, timeZone? }. A custom session without timeZone stays in UTC. Overlaps are computed bar by bar, because each session reads its own zone's clock.
Volume Profile
Distribution of volume by price level, with the Point of Control (POC) and the value area.
import { createVolumeProfileIndicator, setVolumeProfileData } from '@pipsend/charts';

const volumeProfile = createVolumeProfileIndicator(chart, series, {
    numberOfBins: 24,
    valueAreaPercentage: 0.7,
    showPOC: true,
    showValueArea: true
});

setVolumeProfileData(volumeProfile, chartData);   // chartData: [{ time, volume }, ...]
| Option | Default |
|---|---|
numberOfBins |
24 |
valueAreaPercentage |
0.7 (70% of the volume) |
showPOC |
true |
showValueArea |
true |
profileColor |
'#2962FF' |
pocColor |
'#FF6B00' |
valueAreaColor |
'#089981' |
opacity |
0.3 |
width |
100 (pixels, capped at a fifth of the chart) |
position |
'right' (or 'left') |
The option is named numberOfBins. There is no rowSize option.
Customizing indicator colors
applySMA(series, chart, {
    period: 20,
    color: '#FF6B6B',
    lineWidth: 3
});

applyRSI(series, chart, {
    period: 14,
    color: '#4ECDC4',
    lineWidth: 2
});
Drawing tools
Drawing tools are interactive objects painted on the chart canvas. Users can draw them with the mouse or touch, select them, drag their handles or bodies, and delete them. They are managed by a DrawingToolsManager.
Setting up the manager
import { DrawingToolsManager } from '@pipsend/charts';

const drawingManager = new DrawingToolsManager(chart, candlestickSeries, {
    enableKeyboardShortcuts: true,
    selectionColor: '#ff6b00',
    selectionLineWidth: 3
});
Manager options and defaults: enableKeyboardShortcuts true, selectionColor '#2962ff', selectionLineWidth 3.
Every tool is created with a factory that takes a context object { chart, series } and an options object. To let the user draw it, pass interactive: true, then register the tool with the manager:
import { createTrendLineTool } from '@pipsend/charts';

const trendLine = createTrendLineTool(
    { chart, series: candlestickSeries },
    {
        interactive: true,
        lineColor: '#2962FF',
        extendRight: true
    }
);
drawingManager.addTool(trendLine);   // returns the tool id
An interactive tool waits for the user's clicks (one, two or three, depending on the tool) and is placed where they click. Without interactive, pass explicit coordinates (time and price) and the tool is drawn immediately.
Manager API
| Method | Description |
|---|---|
addTool(tool, id?) |
Register a tool. Returns its id. |
removeTool(id) |
Remove one tool. |
clearAll() |
Remove all tools. |
getTool(id), getAllTools(), getToolCount() |
Look tools up. |
startDrawing(type) |
Arm the chart: until stopDrawing(), a press places points of the tool being drawn, even on top of an existing drawing. Takes any tool name as a string. |
stopDrawing(), activeDrawingType() |
Disarm / read the armed type. |
hasPendingDrawing(), cancelPendingDrawings() |
Drawings still waiting for points. |
subscribeDrawingCompleted(handler) / unsubscribeDrawingCompleted(handler) |
Called with the tool id when a drawing is finished. |
selectTool(id), selectTools(ids), toggleToolSelection(id), deselectAll() |
Selection. |
getSelectedToolId(), getSelectedToolIds(), isToolSelected(id) |
Read the selection. |
deleteSelected() |
Remove every unlocked selected drawing, as one undo step. |
subscribeSelectionChanged(handler) / unsubscribeSelectionChanged(handler) |
Receives { id, ids, bounds }. |
selectionBounds() |
Pixel box of the selection, to anchor a floating toolbar. |
undo(), redo(), canUndo(), canRedo(), recordChange() |
Undo history (up to 100 steps). |
serializeAll(), restoreTool(context, data), restoreAll(context, tools, clearExisting?) |
See Serialization. |
destroy() |
Detach all handlers and disarm. |
Interaction and keyboard shortcuts
- Draw by clicking or dragging. While a tool is armed and waiting for points, you can click point by point, or press, drag and release to place the first two points in one gesture (a trend line, rectangle or Fibonacci retracement can be drawn with a single drag). A three-point drawing takes two points from the drag and the third from a click. The mouse wheel and the axes keep working while armed, and touch still pans.
- Select. Click a drawing to select it. Ctrl (or Cmd on macOS) plus click adds or removes a drawing from the selection. Ctrl plus a drag on empty space draws a box and adds every drawing it touches. Dragging any selected drawing moves all of them by the same offset, as one undo step.
- Edit. Drag handles to change a drawing, or its body to move it. Handles appear on hover and respect the lock.
- Keyboard (when
enableKeyboardShortcutsis on and the focus is not in a text field):
| Key | Action |
|---|---|
Delete / Backspace |
Delete the selected drawings. |
Ctrl/Cmd + Z |
Undo. |
Ctrl/Cmd + Shift + Z or Ctrl/Cmd + Y |
Redo. |
Escape |
Disarm the tool, cancel pending drawings and deselect. |
| Double click or right click | Finish an arrow in progress. |
Common methods on every tool
All tools extend DrawingToolBase:
| Method | Description |
|---|---|
remove() |
Remove the tool from the chart. |
applyOptions(options) / options() |
Change or read options at runtime. |
setColor(color) / color() |
Uniform color access. |
show() / hide() |
Visibility. |
lock() / unlock() / isLocked() |
Prevent editing. |
serialize() |
Plain JSON-safe object (see Serialization). |
Common options available on every tool: color, lineWidth, lineStyle ('solid' | 'dashed' | 'dotted'), visible, locked, zIndex, and hoverable.
Set hoverable: false for drawings nobody edits (for example, the output of a script that draws dozens of lines and boxes). They are left out of the hit test, so there is no hover, cursor or selection, and nothing is computed on pointer moves. Locked drawings stay hoverable by default, since a user may select one to unlock it.
Available tools
The following factories are exported. Each takes ({ chart, series }, options).
| Category | Tool | Factory | Type ID |
|---|---|---|---|
| Trading analysis | Position | createPositionTool |
position |
| Trading analysis | Ruler | createRulerTool |
ruler |
| Fibonacci | Retracement | createFibonacciTool |
fibRetracement |
| Fibonacci | Extension | createFibonacciExtensionTool |
fibExtension |
| Fibonacci | Fan | createFibonacciFanTool |
fibFan |
| Lines | Trend line | createTrendLineTool |
trendLine |
| Lines | Horizontal line | createHorizontalLineTool |
horizontalLine |
| Lines | Vertical line | createVerticalLineTool |
verticalLine |
| Lines | Cross line | createCrossLineTool |
crossLine |
| Lines | Arrow | createArrowTool |
arrow |
| Channels | Parallel channel | createParallelChannelTool |
parallelChannel |
| Channels | Andrews' pitchfork | createPitchforkTool |
pitchfork |
| Shapes | Rectangle | createRectangleTool |
rectangle |
| Shapes | Circle / ellipse | createCircleTool |
circle |
| Shapes | Polygon (3 or more vertices) | createPolygonTool |
polygon |
| Shapes | Gantt / timeline | createGanttTool |
gantt |
| Annotations | Brush (freehand) | createBrushTool |
brush |
| Annotations | Text | createTextTool |
text |
Rays and extended lines are covered by options on the line tools: extendLeft and extendRight on the trend line, and startTime on the horizontal line (a horizontal ray).
Position tool
Marks a trade with entry, stop loss and take profit, and calculates risk/reward metrics. Pips are detected automatically from the number of decimals in the price (4 or more decimals: 0.0001, 3 decimals: 0.001, 2 decimals: 0.01, 0 or 1 decimal: 1). You can override this with pipConfig. The old symbol option was removed in 1.1.0 and is ignored.
import { createPositionTool } from '@pipsend/charts';

const position = createPositionTool(
    { chart, series: candlestickSeries },
    {
        entryPrice: 1.1000,
        entryTime: 1642000000,
        endTime: 1642086400,
        stopLoss: 1.0950,
        takeProfit: 1.1100,
        quantity: 1.0,
        onUpdate: (metrics) => {
            console.log('Risk (pips):', metrics.stopLossPips);
            console.log('Reward (pips):', metrics.takeProfitPips);
            console.log('R:R ratio:', metrics.riskRewardRatio);
        }
    }
);
Options: entryPrice and entryTime (required), endTime, stopLoss, takeProfit, quantity, pipConfig, interactive, profitColor, lossColor, entryLineColor, opacity, showTooltips, onUpdate, onRemove.
PositionMetrics: entryPrice, stopLoss, takeProfit, quantity?, stopLossPips, takeProfitPips, stopLossPercent, takeProfitPercent, riskRewardRatio, stopLossAmount?, takeProfitAmount?.
With interactive: true, the position waits for a click and is placed there, also to the right of the last bar. A position without endTime takes a fifth of the pane.
Ruler tool
Measures price distance, percentage change, pips, and number of bars between two points.
import { createRulerTool } from '@pipsend/charts';

const ruler = createRulerTool(
    { chart, series: candlestickSeries },
    {
        interactive: true,
        lineColor: '#2962FF',
        onUpdate: (metrics) => {
            console.log('Pips:', metrics.pips);
            console.log('Change %:', metrics.pricePercent);
            console.log('Bars:', metrics.barCount);
        }
    }
);
Options: point1Time, point1Price, point2Time, point2Price, symbol, pipConfig, interactive, measure ('both', 'price' or 'time', to measure along a single axis), lineColor, lineWidth, showLabel, labelBackgroundColor, labelTextColor, selectionColor, selectionLineWidth, onUpdate, onRemove.
RulerMetrics includes point1, point2, priceDifference, pricePercent, pips, timeDifference (seconds) and barCount.
Fibonacci retracement
import { createFibonacciTool } from '@pipsend/charts';

const fib = createFibonacciTool(
    { chart, series: candlestickSeries },
    {
        point1Time: startTime,
        point1Price: lowPrice,
        point2Time: endTime,
        point2Price: highPrice,
        levels: [0, 0.236, 0.382, 0.5, 0.618, 0.786, 1],
        showLabels: true
    }
);
Options: point1Time, point1Price, point2Time, point2Price, useExtended, levels (plain ratios, which override useExtended), interactive, lineColor, lineWidth, showLabels, labelPosition ('left' or 'right'), levelColors (an object keyed by ratio as a string, for example "0.618"), onUpdate, onRemove.
Standard levels (used when levels is omitted): 0, 23.6%, 38.2%, 50%, 61.8%, 78.6%, 100%. With useExtended: true, the set also includes 127.2%, 141.4%, 161.8%, 200% and 261.8%. The ratio lists are exported as STANDARD_FIBONACCI_RATIOS and EXTENDED_FIBONACCI_RATIOS.
Fibonacci extension
A three-point projection for price targets. With interactive: true, click point A (swing low), point B (swing high), then point C (retracement level).
import { createFibonacciExtensionTool } from '@pipsend/charts';

const fibExt = createFibonacciExtensionTool(
    { chart, series: candlestickSeries },
    {
        interactive: true,
        showLabels: true,
        onUpdate: () => {
            const levels = fibExt.getExtensionLevels();
            console.log('Extension levels:', levels);
        }
    }
);
Options: point1, point2, point3 (each { time, price }), levels (an array of { level, color, label }), lineColor, lineWidth, showLabels, extendLines, interactive, onUpdate, onRemove. Default levels: 0, 61.8%, 100%, 161.8%, 261.8%.
Fibonacci fan
import { createFibonacciFanTool } from '@pipsend/charts';

const fibFan = createFibonacciFanTool(
    { chart, series: candlestickSeries },
    {
        interactive: true,
        showLabels: true,
        extendLines: true
    }
);
Options: point1Time, point1Price, point2Time, point2Price, levels ({ level, color, label }), lineWidth, showLabels, extendLines, interactive. Default fan levels: 38.2%, 50%, 61.8%.
Trend line
import { createTrendLineTool } from '@pipsend/charts';

const trendLine = createTrendLineTool(
    { chart, series: candlestickSeries },
    {
        interactive: true,
        lineColor: '#2962FF',
        lineStyle: 'solid',
        lineWidth: 2,
        extendRight: true,
        extendLeft: false
    }
);
Options: point1Time, point1Price, point2Time, point2Price, interactive, lineColor, lineWidth, lineStyle ('solid', 'dashed', 'dotted'), extendLeft, extendRight, showPriceLabel, onUpdate, onRemove.
Horizontal line
import { createHorizontalLineTool } from '@pipsend/charts';

const hLine = createHorizontalLineTool(
    { chart, series: candlestickSeries },
    {
        price: 1.1050,
        lineColor: '#2962FF',
        lineStyle: 'solid',
        lineWidth: 2,
        showLabel: true,
        labelText: 'Resistance'
    }
);
Options: price, interactive (waits for a click that sets the level), startTime (set it and the line becomes a horizontal ray from that time to the right edge; left undefined it spans the whole chart), lineColor, lineWidth, lineStyle, showLabel, labelText, showPriceLabel, onUpdate, onRemove. Drag to adjust the price.
Vertical line
import { createVerticalLineTool } from '@pipsend/charts';

const vLine = createVerticalLineTool(
    { chart, series: candlestickSeries },
    {
        time: eventTime,
        lineColor: '#787B86',
        lineStyle: 'dashed',
        lineWidth: 1,
        showLabel: true,
        labelText: 'News Event'
    }
);
Options: time, interactive, lineColor, lineWidth, lineStyle, showLabel, labelText, onUpdate, onRemove. Typical uses: economic events, news releases, session opens and closes.
Cross line
A horizontal and a vertical line crossing at one point. Options: time, price, interactive (waits for a click that sets both), lineColor, lineWidth, lineStyle, showPriceLabel, onUpdate, onRemove.
Arrow
Connects several points with lines and an arrow head on the last one.
import { createArrowTool } from '@pipsend/charts';

const arrow = createArrowTool(
    { chart, series: candlestickSeries },
    {
        interactive: true,
        lineColor: '#2962FF',
        lineWidth: 2,
        showArrowHead: true,
        showCircles: true,
        circleRadius: 4
    }
);
Options: points (an array of { time, price }), interactive, lineColor, lineWidth, showArrowHead, showCircles, circleRadius, onUpdate, onRemove, onComplete. Click to add points; finish with a double click or a right click.
Parallel channel
Options: point1Time, point1Price, point2Time, point2Price, channelWidth (distance to the parallel line, in price; negative sits below), interactive, lineColor, lineWidth, lineStyle, fillColor, fillOpacity, extendRight, showPriceLabel, onUpdate, onRemove, onComplete.
Andrews' pitchfork
Options: pivotTime, pivotPrice (the pivot the fork opens from), upperTime, upperPrice, lowerTime, lowerPrice (the two points whose midpoint the median line runs through), interactive, lineColor, lineWidth, lineStyle, fillColor, fillOpacity, onUpdate, onRemove, onComplete.
Rectangle
For order blocks, supply and demand zones, consolidation areas and price ranges.
import { createRectangleTool } from '@pipsend/charts';

const rectangle = createRectangleTool(
    { chart, series: candlestickSeries },
    {
        interactive: true,
        fillColor: '#2962FF',
        fillOpacity: 0.2,
        borderColor: '#2962FF',
        borderWidth: 2,
        borderStyle: 'solid',
        showLabel: true,
        labelText: 'Order Block',
        labelPosition: 'top-left'
    }
);
Options: time1, price1, time2, price2, interactive, fillColor, fillOpacity, borderColor, borderWidth, borderStyle, showLabel, labelText, labelPosition ('top-left', 'top-right', 'bottom-left', 'bottom-right', 'center', 'left', 'right'), labelColor, labelBackgroundColor, labelFontSize, onUpdate, onRemove. Click twice to set the corners, drag corners to resize, drag the body to move. A borderWidth of 0 draws no border.
Circle / ellipse
import { createCircleTool } from '@pipsend/charts';

const circle = createCircleTool(
    { chart, series: candlestickSeries },
    {
        interactive: true,
        fillColor: '#2962FF',
        fillOpacity: 0.1,
        borderColor: '#2962FF',
        borderWidth: 2,
        borderStyle: 'solid'
    }
);
Options: centerTime, centerPrice, radiusTime, radiusPrice, interactive, fillColor, fillOpacity, borderColor, borderWidth, borderStyle, showLabel, labelText, onUpdate, onRemove. Click to set the center and again to set the radius; the ellipse adapts to the price/time scale.
Polygon
Three or more vertices (so it also draws triangles). Options: points (an array of { time, price }), interactive, fillColor, fillOpacity, borderColor, borderWidth, borderStyle, onUpdate, onRemove, onComplete.
Gantt / timeline
Visualizes time ranges and trade planning across several rows.
import { createGanttTool } from '@pipsend/charts';

const gantt = createGanttTool(
    { chart, series: candlestickSeries },
    {
        segments: [
            {
                startTime: time1,
                endTime: time2,
                level: 0,
                label: 'Analysis Phase',
                color: '#2196F3',
                category: 'planning'
            },
            {
                startTime: time2,
                endTime: time3,
                level: 1,
                label: 'Entry Zone',
                color: '#4CAF50',
                category: 'trade'
            }
        ],
        rowHeight: 40,
        rowSpacing: 5,
        fillOpacity: 0.7,
        showLabels: true
    }
);
Options: segments ({ startTime, endTime, level, label, color, category? }), interactive, rowHeight, rowSpacing, fillOpacity, borderWidth, showLabels, showGrid, onUpdate, onRemove.
Brush
Freehand drawing with Catmull-Rom spline smoothing.
import { createBrushTool } from '@pipsend/charts';

const brush = createBrushTool(
    { chart, series: candlestickSeries },
    {
        color: '#2962FF',
        lineWidth: 2,
        smoothing: true,
        onComplete: () => {
            console.log('Brush stroke completed');
        }
    }
);
Options: points (an array of { time, price }), color, lineWidth, smoothing, sampleDistance, onUpdate, onRemove, onComplete. While the brush is armed, press and drag to draw as many strokes as you like; stroke samples are taken by distance and converted to time/price when the stroke ends. The brush only listens inside the drawing area, so the axes keep working. Each Ctrl/Cmd + Z removes one stroke.
Text
import { createTextTool } from '@pipsend/charts';

const text = createTextTool(
    { chart, series: candlestickSeries },
    {
        text: 'Important Level',
        fontSize: 14,
        textColor: '#FFFFFF',
        backgroundColor: '#2962FF',
        backgroundOpacity: 0.9,
        padding: 8,
        borderWidth: 1,
        textAlign: 'left',
        maxWidth: 200,
        time: annotationTime,
        price: annotationPrice
    }
);
Options: time, price, text, fontSize, fontFamily, textColor, backgroundColor, backgroundOpacity, padding, borderColor, borderWidth, textAlign ('left', 'center', 'right'), maxWidth, anchor ('top-left' by default, 'left', 'right', 'center': where the time/price point falls on the label), pointer (draws a tail toward the point), borderRadius, interactive, onUpdate, onRemove, onTextChange, onComplete. Text can be edited inline: type directly on the chart, press Enter or click outside to finish, press Escape to cancel. backgroundOpacity: 0 and padding: 0 are honored, so text without a background is possible.
Common style properties
Most tools use these names:
{
    // Line styles
    lineColor: '#2962FF',
    lineWidth: 2,
    lineStyle: 'solid' | 'dashed' | 'dotted',

    // Fill styles
    fillColor: '#2962FF',
    fillOpacity: 0.2,

    // Border styles
    borderColor: '#2962FF',
    borderWidth: 2,
    borderStyle: 'solid' | 'dashed' | 'dotted',

    // Labels
    showLabel: true,
    labelText: 'Custom Label',
    labelPosition: 'top-left' | 'top-right' | 'bottom-left' | 'bottom-right' | 'center'
}
Drawing beyond the last bar
timeFromCoordinate() and coordinateFromTime() are exported helpers that extrapolate by logical index where the chart engine returns null, so drawings can be placed to the right of the last bar.
Best practices
- Keep the number of active tools reasonable (fewer than 20 is recommended for best performance), and remove unused ones with
tool.remove()ordrawingManager.clearAll(). - Keep references to the tools you create so you can update or remove them.
- Show instructions for multi-step tools (for example, the three clicks of a Fibonacci extension).
Complete example
import {
    createChart,
    CandlestickSeries,
    DrawingToolsManager,
    createPositionTool,
    createTrendLineTool,
    createFibonacciTool,
    createRectangleTool,
    createTextTool
} from '@pipsend/charts';

const chart = createChart(document.getElementById('chart'), {
    width: 800,
    height: 600
});

const candlestickSeries = chart.addSeries(CandlestickSeries);
candlestickSeries.setData(data);

const drawingManager = new DrawingToolsManager(chart, candlestickSeries);

// Position tool
const position = createPositionTool(
    { chart, series: candlestickSeries },
    {
        entryPrice: 1.1000,
        entryTime: data[50].time,
        stopLoss: 1.0950,
        takeProfit: 1.1100,
        onUpdate: (metrics) => {
            console.log('R:R:', metrics.riskRewardRatio);
        }
    }
);
drawingManager.addTool(position);

// Trend line (interactive)
const trendLine = createTrendLineTool(
    { chart, series: candlestickSeries },
    { interactive: true, lineColor: '#2962FF', extendRight: true }
);
drawingManager.addTool(trendLine);

// Fibonacci retracement
const fib = createFibonacciTool(
    { chart, series: candlestickSeries },
    {
        point1Time: startTime,
        point1Price: 1.0850,
        point2Time: endTime,
        point2Price: 1.1100,
        showLabels: true
    }
);
drawingManager.addTool(fib);

// Order block rectangle
const orderBlock = createRectangleTool(
    { chart, series: candlestickSeries },
    {
        interactive: true,
        fillColor: '#089981',
        fillOpacity: 0.2,
        labelText: 'Demand Zone'
    }
);
drawingManager.addTool(orderBlock);

// Text annotation
const note = createTextTool(
    { chart, series: candlestickSeries },
    {
        text: 'Key Support Level',
        fontSize: 14,
        backgroundColor: '#2962FF',
        time: noteTime,
        price: notePrice
    }
);
drawingManager.addTool(note);
Trading features
Trading lines
createTradingLine(series, chart, options) creates a horizontal price line that the user can drag. Lines are draggable by default.
import {
    createTradingLine,
    createInteractiveLineManager,
    LineStyle
} from '@pipsend/charts';

// 1. Stop Loss with preset
const stopLoss = createTradingLine(series, chart, {
    price: 95.00,
    type: 'stop-loss',
    onDragStart: (price) => console.log('Drag started'),
    onDragMove: (price) => console.log('Moving:', price),
    onDragEnd: (price) => console.log('Final:', price)
});

// 2. Take Profit with preset
const takeProfit = createTradingLine(series, chart, {
    price: 110.00,
    type: 'take-profit',
    onDragEnd: (price) => updateOrderInBackend(price)
});

// 3. Entry line
const entry = createTradingLine(series, chart, {
    price: 100.00,
    type: 'entry'
});

// 4. Custom line with full control
const customLine = createTradingLine(series, chart, {
    price: 105.00,
    title: 'Target 1',
    color: '#FF9800',
    lineStyle: LineStyle.Dashed,
    lineWidth: 2,
    draggable: true,
    onDragEnd: (price) => console.log('Custom line:', price)
});
Preset types: 'stop-loss', 'take-profit', 'entry', 'target', 'resistance', 'support', 'custom'.
| Preset | Color | Style | Title |
|---|---|---|---|
stop-loss |
#ef5350 |
Dashed | Stop Loss |
take-profit |
#26a69a |
Dashed | Take Profit |
entry |
#2196F3 |
Solid | Entry |
target |
#FF9800 |
Dashed | Target |
resistance |
#f44336 |
Solid | Resistance |
support |
#4CAF50 |
Solid | Support |
custom |
#9E9E9E |
Solid | (empty) |
All presets are draggable by default; user options override the preset.
Trading line options:
{
    price: number;                          // Required: line price
    type?: TradingLineType;                 // Preset (see above)
    title?: string;                         // Label text
    color?: string;                         // Line color
    lineWidth?: LineWidth;                  // Line width (1-4), default 2
    lineStyle?: LineStyle;                  // Solid, Dashed, etc.
    draggable?: boolean;                    // Enable dragging
    axisLabelVisible?: boolean;             // Show price on axis (default true)
    onDragStart?: (price: number) => void;  // Drag start callback
    onDragMove?: (price: number) => void;   // Drag move callback
    onDragEnd?: (price: number) => void;    // Drag end callback
    onClick?: (price: number) => void;      // Click without dragging (also for non-draggable lines)
    formatTitle?: (price: number) => string; // Dynamic title, e.g. a live P&L preview
}
Line methods:
const currentPrice = stopLoss.getPrice();   // Get current price
stopLoss.setPrice(93.00);                   // Update price programmatically
stopLoss.setTitle('Floating PnL: +12.50');  // Set the title immediately (bypasses formatTitle)
stopLoss.applyOptions({                     // Update options
    color: '#FF0000',
    title: 'New Stop Loss'
});
stopLoss.remove();                          // Remove line
onClick fires on a press and release without significant movement (under 4 px with a mouse, 12 px with a finger), so non-draggable lines can be made clickable (for example, "click an entry line to expand its SL/TP").
Click-to-create lines
createInteractiveLineManager(chart, series) arms the chart so the next click drops a line at the clicked price.
const manager = createInteractiveLineManager(chart, series);

document.getElementById('addStopLoss').onclick = async () => {
    const line = await manager.enableClickToCreate('stop-loss');
    // The promise resolves once the user has clicked on the chart
};

document.getElementById('addAlert').onclick = async () => {
    await manager.enableClickToCreate('custom', {
        title: 'Alert',
        color: '#FFC107',
        onDragEnd: (price) => api.createAlert(price)
    });
};
Modes: 'stop-loss', 'take-profit', 'entry', 'target', 'resistance', 'support', 'custom'. Other methods: disableClickToCreate(), getCreationMode(), isCreating().
Position lines
createPositionLine draws entry, take profit and stop loss as one unit: a label per level carrying a size badge and the P&L, a close button, and a connector tying the three together.
import { createPositionLine } from '@pipsend/charts';

const position = createPositionLine(series, chart, {
    entry: { price: 4306.79, badge: '1', formatText: () => '+ 2.32 USD' },
    takeProfit: { price: 4349.58, badge: '1', formatText: (p) => `+ ${(p - 4306.79).toFixed(2)} USD` },
    stopLoss: { price: 4266.06, badge: '1', formatText: (p) => `- ${(4306.79 - p).toFixed(2)} USD` },
    onDragEnd: (level, price) => updateOrderInBackend(level, price),
    onClose: (level) => cancelOrder(level)
});

position.setPrice('takeProfit', 4360);          // move a level
position.applyOptions({ stopLoss: undefined }); // drop a level
position.prices();                              // { entry, takeProfit }
position.remove();
Every level ('entry', 'takeProfit', 'stopLoss') is draggable and closable by default; set draggable: false or closable: false per level. Only the label takes the pointer.
Level options: price (required), text, badge, badgeFilled (default true for the entry, false otherwise), color, lineWidth (default 1), lineStyle (solid for the entry, dashed otherwise), draggable (true), closable (true), axisLabelVisible (true), formatText(price) (called on every price change, which keeps a live P&L in step with a drag). Default colors: entry #2962FF, take profit #26A17B, stop loss #D9A23B.
Group options: visible (true), connectorVisible (true), rightOffset (56), theme, and the callbacks onDragStart, onDragMove, onDragEnd, onDragCancel, onClose, onClick, each receiving (level, price) or (level).
The label look is shared through theme (background, textColor, badgeTextColor, borderRadius, borderWidth, paddingX, paddingY, fontSize, fontFamily, backgroundOpacity). The label background defaults to the chart's own background, so it reads on light and dark themes alike.
Behavior notes:
- While a level is being dragged, it owns its price:
applyOptionsandsetPricedo not move that level, so a feed that resends the old price several times a second cannot pull the line out from under the cursor. The other parts of the group keep updating. onDragCancelreports a gesture that never confirmed (the pointer left the chart, Escape was pressed, or the line was removed). Together withonDragEnd, every drag that starts ends with a notification.- Labels that would overlap are fanned out so each can still be grabbed. All lines on the same chart (positions, pending orders, alerts) share the layout.
- Touch is supported, with wider hit targets for a finger.
Markers
createSeriesMarkers(series, markers) places markers on bars.
import { createSeriesMarkers } from '@pipsend/charts';

const markers = createSeriesMarkers(series, [
    { time: '2024-01-03', position: 'belowBar', color: 'green', shape: 'arrowUp', text: 'BUY' }
]);

markers.setMarkers([]);   // clear
shape:'circle','square','arrowUp','arrowDown','tag','xcross'.position:'aboveBar','belowBar','inBar', or at a price with'atPriceTop','atPriceBottom','atPriceMiddle'(these need aprice).- Other fields:
id,text,size,textColor,borderColor,borderWidth,borderRadius. - The returned API has
setMarkers(),markers()anddetach(). createSeriesMarkersacceptshoverable: falsefor markers nobody edits.xcrossdraws a thin cross, the usual mark of a cancelled or expired signal.
'tag' draws the text inside a rounded bubble with a tip pointing at the candle, the format of BUY/SELL signals on trading platforms. The other shapes draw the text beside the shape.
createSeriesMarkers(series, [
    {
        time: '2024-01-03',
        position: 'belowBar',
        shape: 'tag',
        color: '#26a69a',
        text: 'BUY',
        textColor: '#FFFFFF',   // white by default
        borderColor: '#0f3f38', // optional
        borderRadius: 6         // 6 by default
    }
]);
size scales the bubble and its tip like it scales the other shapes. Markers older than the first loaded bar are left out and appear on their own bars once the data reaches them.
Position markers (trade history)
createPositionMarkers shows closed and open trades as entry and exit markers.
import { createPositionMarkers } from '@pipsend/charts';

const positionMarkers = createPositionMarkers(candleSeries, [], {
    longColors: {
        entry: '#26a69a',
        exit: '#ef5350'
    },
    shortColors: {
        entry: '#ef5350',
        exit: '#26a69a'
    },
    defaultSize: 1.5
});

positionMarkers.addPosition({
    type: 'long',
    entry: { time: entryBar.time, price: entryBar.close },
    exit: { time: exitBar.time, price: exitBar.close },
    id: 'pos-1',
    text: { entry: 'BUY', exit: 'SELL' }
});
A TradingPosition has type ('long' or 'short'), entry, an optional exit (absent while the position is open), id, color, size, and text. The manager offers addPosition, addPositions, setPositions, closePosition(id, exit, exitText?), removePosition(id), clearPositions(), getPositions() and applyOptions(). Options: longColors, shortColors, defaultSize, entryOffset, exitOffset.
Orders and alerts
The library does not send orders. Trading lines and position lines are the visual and interactive layer: use the drag and close callbacks to update or cancel an order in your own backend.
const stopLoss = createTradingLine(series, chart, {
    price: currentPrice * 0.98,
    type: 'stop-loss',
    onDragEnd: async (price) => {
        await fetch('/api/orders/update', {
            method: 'POST',
            body: JSON.stringify({ stopLoss: price })
        });
    }
});
Serialization
All drawing tools support full serialization and deserialization. This enables:
- Chart templates: save and load chart configurations to and from your backend.
- Chart sync: synchronize chart state between devices, for example over a WebSocket.
Save and restore
import {
  DrawingToolsManager,
  SerializedDrawingTool,
  DrawingContext,
} from '@pipsend/charts';

// --- Serialize (save) ---
const serialized: SerializedDrawingTool[] = manager.serializeAll();
const json = JSON.stringify(serialized);
// Send `json` to backend or WebSocket

// --- Deserialize (restore) ---
const data: SerializedDrawingTool[] = JSON.parse(json);
const context: DrawingContext = { chart, series };
manager.restoreAll(context, data);
API
SerializedDrawingTool:
interface SerializedDrawingTool {
  type: string;
  points: Array<{ price: number; time: Time | null }>;
  style: Record<string, any>;
  extra?: Record<string, any>;
}
| Field | Description |
|---|---|
type |
Tool type identifier (for example "brush", "trendLine", "fibRetracement"). |
points |
Coordinate points. Each has price (float) and time (Unix timestamp or null). |
style |
All visual properties: colors, widths, opacities, etc. |
extra |
Tool-specific data not covered by points and style (levels, segments, text content, etc.). |
Methods:
tool.serialize(): SerializedDrawingTool(on every tool) returns a plain JSON-safe object with everything needed to recreate it. Newer versions also include the tool'sid,visibleandlockedstate.manager.serializeAll(): SerializedDrawingTool[]serializes every managed tool.manager.restoreTool(context, data): DrawingToolBaserecreates one tool and adds it to the manager. Returns the new tool instance.manager.restoreAll(context, tools, clearExisting?)restores an array. By default it clears existing tools first (clearExisting = true).
// Replace all tools with saved state
manager.restoreAll(context, savedTools);

// Append saved tools without clearing
manager.restoreAll(context, savedTools, false);
The helpers extractPoint, extractTime and makeSerializedPoint are also exported.
Type IDs
| Type ID | Tool | Factory |
|---|---|---|
trendLine |
Trend Line | createTrendLineTool |
horizontalLine |
Horizontal Line | createHorizontalLineTool |
verticalLine |
Vertical Line | createVerticalLineTool |
crossLine |
Cross Line | createCrossLineTool |
parallelChannel |
Parallel Channel | createParallelChannelTool |
pitchfork |
Pitchfork | createPitchforkTool |
polygon |
Polygon | createPolygonTool |
fibRetracement |
Fibonacci Retracement | createFibonacciTool |
fibExtension |
Fibonacci Extension | createFibonacciExtensionTool |
fibFan |
Fibonacci Fan | createFibonacciFanTool |
rectangle |
Rectangle | createRectangleTool |
circle |
Circle / Ellipse | createCircleTool |
arrow |
Arrow | createArrowTool |
brush |
Brush / Freehand | createBrushTool |
text |
Text Annotation | createTextTool |
ruler |
Ruler | createRulerTool |
position |
Position (Risk/Reward) | createPositionTool |
gantt |
Timeline / Gantt | createGanttTool |
Output examples
Trend line:
{
  "type": "trendLine",
  "points": [
    { "price": 1.08500, "time": 1711756800 },
    { "price": 1.09100, "time": 1711929600 }
  ],
  "style": {
    "lineColor": "#3B82F6",
    "lineWidth": 2,
    "lineStyle": "solid",
    "extendLeft": false,
    "extendRight": false
  }
}
Horizontal line (time is null because it spans the chart):
{
  "type": "horizontalLine",
  "points": [{ "price": 1.09000, "time": null }],
  "style": {
    "lineColor": "#8B5CF6",
    "lineWidth": 2,
    "lineStyle": "solid",
    "showLabel": true,
    "labelText": "Support"
  }
}
Fibonacci retracement:
{
  "type": "fibRetracement",
  "points": [
    { "price": 1.08750, "time": 1711843206 },
    { "price": 1.09200, "time": 1711929600 }
  ],
  "style": {
    "lineColor": "#787b86",
    "lineWidth": 1,
    "showLabels": true,
    "labelPosition": "right",
    "levelColors": { "0": "#787b86", "0.618": "#4caf50", "1": "#787b86" }
  },
  "extra": {
    "levels": [0, 0.236, 0.382, 0.5, 0.618, 0.786, 1],
    "useExtended": false
  }
}
Rectangle:
{
  "type": "rectangle",
  "points": [
    { "price": 1.08500, "time": 1711756800 },
    { "price": 1.09100, "time": 1711929600 }
  ],
  "style": {
    "fillColor": "#2962FF",
    "fillOpacity": 0.2,
    "borderColor": "#2962FF",
    "borderWidth": 2,
    "borderStyle": "solid",
    "showLabel": true,
    "labelText": "Zone",
    "labelPosition": "top-left"
  }
}
Position:
{
  "type": "position",
  "points": [{ "price": 1.09000, "time": 1711843200 }],
  "style": {
    "profitColor": "#26a69a",
    "lossColor": "#ef5350",
    "entryLineColor": "#ffffff",
    "opacity": 0.3,
    "showTooltips": true
  },
  "extra": {
    "endTime": 1711929600,
    "stopLoss": 1.08500,
    "takeProfit": 1.09500,
    "quantity": 1.0
  }
}
Text annotation:
{
  "type": "text",
  "points": [{ "price": 1.08900, "time": 1711843200 }],
  "style": {
    "fontSize": 14,
    "fontFamily": "Arial, sans-serif",
    "textColor": "#FFFFFF",
    "backgroundColor": "#2962FF",
    "backgroundOpacity": 0.8,
    "padding": 8,
    "borderColor": "#2962FF",
    "borderWidth": 1,
    "textAlign": "left",
    "maxWidth": 200
  },
  "extra": { "text": "Key support level" }
}
Gantt:
{
  "type": "gantt",
  "points": [],
  "style": {
    "rowHeight": 40,
    "rowSpacing": 5,
    "fillOpacity": 0.7,
    "borderWidth": 2,
    "showLabels": true,
    "showGrid": true
  },
  "extra": {
    "segments": [
      {
        "startTime": 1711756800,
        "endTime": 1711929600,
        "level": 0,
        "label": "Phase 1",
        "color": "#2962FF",
        "category": "development"
      }
    ]
  }
}
The other tools follow the same structure: geometry in points, visual properties in style, and tool-specific data (Fibonacci levels, circle radius, ruler symbol, text content) in extra.
Chart templates (save and load)
async function saveTemplate(manager: DrawingToolsManager, name: string) {
  const drawings = manager.serializeAll();
  await fetch('/api/templates', {
    method: 'POST',
    body: JSON.stringify({ name, drawings, savedAt: Date.now() }),
  });
}

async function loadTemplate(manager: DrawingToolsManager, context: DrawingContext, id: string) {
  const res = await fetch(`/api/templates/${id}`);
  const { drawings } = await res.json();
  manager.restoreAll(context, drawings);
}
Chart sync (WebSocket)
// Sender
ws.send(JSON.stringify({ type: 'sync', drawings: manager.serializeAll() }));

// Receiver
ws.onmessage = (e) => {
  const msg = JSON.parse(e.data);
  if (msg.type === 'sync') manager.restoreAll(context, msg.drawings);
};
Notes
- Callbacks are not serialized. Re-attach
onUpdate,onRemove, etc. after a restore if you need them. - Interactive mode is not activated on restore. Tools come back in their completed state.
- Tool IDs are regenerated on restore (unless the saved data carries one). Use the return value of
restoreTool()to get the new instance. timevalues are Unix timestamps in seconds, matching the chart'sTimetype. Horizontal lines usetime: null.restoreAllclears by default. Passfalseas the third argument to append instead.- Data saved by versions before 2.4.0 cannot restore the segments of timelines or the levels of Fibonacci extensions and fans (they were saved under renamed keys). Drawings saved with 2.4.0 or later restore correctly.
- Restored tools render correctly even on a chart whose candles differ from the ones they were drawn on: timestamps without an exact candle fall back to the nearest one.
- Undo (
Ctrl/Cmd + Z) restores drawings through the same path, so it benefits from the same fixes.
Theming and styling
Everything visual is a chart option, and options can be changed at runtime with chart.applyOptions().
Dark and light themes
// Dark Theme
const chart = createChart(container, {
    layout: {
        background: { color: '#1E222D' },
        textColor: '#D9D9D9',
    },
    grid: {
        vertLines: { color: '#2B2B43' },
        horzLines: { color: '#363C4E' },
    },
});

// Light Theme
const chart = createChart(container, {
    layout: {
        background: { color: '#FFFFFF' },
        textColor: '#191919',
    },
    grid: {
        vertLines: { color: '#e1e1e1' },
        horzLines: { color: '#e1e1e1' },
    },
});
Switching theme on a live chart:
chart.applyOptions({
    layout: { background: { color: '#0b0e14' }, textColor: '#d1d4dc' },
    grid: { vertLines: { color: '#151922' }, horzLines: { color: '#151922' } },
});
A full modern dark setup, from the library's trading UI example:
const chart = createChart(document.getElementById('chart'), {
    layout: {
        background: { type: 'solid', color: '#0b0e14' },
        textColor: '#d1d4dc',
        fontSize: 12,
    },
    grid: {
        vertLines: { color: '#151922' },
        horzLines: { color: '#151922' },
    },
    rightPriceScale: { borderColor: '#1e222d' },
    timeScale: { borderColor: '#1e222d', rightOffset: 12 },
    crosshair: { mode: 0 },
});
Series colors
const series = chart.addSeries(CandlestickSeries, {
    upColor: '#26a69a',
    downColor: '#ef5350',
    borderVisible: false,
    wickUpColor: '#26a69a',
    wickDownColor: '#ef5350',
});
Crosshair
crosshair.mode accepts CrosshairMode.Normal (moves freely), Magnet (sticks to the close price of OHLC series; the default), MagnetOHLC (sticks to the open, high, low or close), and Hidden. crosshair.vertLine and crosshair.horzLine each take color, width, style, visible, labelVisible and labelBackgroundColor.
Line styles
LineStyle values: Solid (0), Dotted (1), Dashed (2), LargeDashed (3), SparseDotted (4). Line widths for lines and indicators are 1 to 4.
Drawing tool and indicator colors
Every drawing tool takes color options (lineColor, fillColor, borderColor, ...) and supports tool.setColor(color). Every indicator takes its own color options and supports applyOptions({ color }) at runtime.
Responsive charts
window.addEventListener('resize', () => {
    chart.applyOptions({ width: window.innerWidth });
});
Or let the chart follow its container with autoSize: true.
Watermarks
createTextWatermark(pane, options) and createImageWatermark(pane, options) add a watermark to a pane.
Events and API reference
Chart events
chart.subscribeClick((param) => {
    console.log('Clicked at', param.time, param.point);
});

chart.subscribeCrosshairMove((param) => {
    if (!param.time) return;
    const bar = param.seriesData.get(series);
    console.log(param.time, bar);
});
The handler receives a MouseEventParams with: time, logical, point, paneIndex, seriesData (a Map of series to the bar under the cursor), hoveredSeries, hoveredObjectId, and sourceEvent. Unsubscribe with unsubscribeClick, unsubscribeDblClick and unsubscribeCrosshairMove.
Other events: timeScale().subscribeVisibleTimeRangeChange(...), subscribeVisibleLogicalRangeChange(...), subscribeSizeChange(...), and series.subscribeDataChanged(...).
Drawing manager events
drawingManager.subscribeSelectionChanged(({ id, ids, bounds }) => {
    // id is set only when exactly one drawing is selected; bounds boxes them all
});

drawingManager.subscribeDrawingCompleted((toolId) => {
    console.log('Finished drawing', toolId);
});
Exports at a glance
| Area | Exports |
|---|---|
| Chart | createChart, createChartEx, version, timeFromCoordinate, coordinateFromTime, timeZoneOffset |
| Series definitions | CandlestickSeries, BarSeries, LineSeries, AreaSeries, BaselineSeries, HistogramSeries |
| Enums | LineStyle, LineType, CrosshairMode, PriceScaleMode, PriceLineSource, LastPriceAnimationMode, ColorType, TickMarkType, TrackingModeExitMode, MismatchDirection |
| Plugins | createSeriesMarkers, createUpDownMarkers, createTimeLabels, createPositionMarkers, createTextWatermark, createImageWatermark |
| Indicators | applySMA, applyEMA, applyWMA, applyBollingerBands, applyKeltnerChannels, applyDonchianChannels, applyParabolicSAR, applyVWAP, applySuperTrend, applyIchimoku, applyPivotPoints, applyRSI, applyMACD, applyStochastic, applyATR, applyVolume, applyOBV, applyADX, applyCCI, applyWilliamsR, applyMFI, createTradingSessionsIndicator, createVolumeProfileIndicator |
| Indicator helpers | setSeriesVolumes, setVolumeProfileData, applyHeikinAshi, calculateHeikinAshi, hideSeriesPaint, DEFAULT_SESSIONS |
| Trading | createTradingLine, createInteractiveLineManager, createPositionLine, DraggablePriceLine, InteractiveLineManager, PositionLine |
| Drawing | DrawingToolsManager, DrawingToolBase, the 18 create*Tool factories, STANDARD_FIBONACCI_RATIOS, EXTENDED_FIBONACCI_RATIOS, getPipConfig, calculatePipConfig |
The package ships TypeScript definitions for all of these (for example IChartApi, ISeriesApi, CandlestickData, SerializedDrawingTool, DrawingContext, the *Options types of each indicator and tool, and IndicatorRuntime).
Standalone build
When loaded from a script tag, every export above is available on window.PipsendCharts, for example PipsendCharts.createChart, PipsendCharts.CandlestickSeries, PipsendCharts.applySMA.
Framework integration
The library works with any framework: create the chart in the mount hook, update the series when data changes, and call chart.remove() when the component unmounts.
React
import { useEffect, useRef } from 'react';
import { createChart, CandlestickSeries, applySMA, applyRSI } from '@pipsend/charts';

function TradingChart({ data }) {
    const chartContainerRef = useRef<HTMLDivElement>(null);
    const chartRef = useRef<any>(null);
    const seriesRef = useRef<any>(null);

    useEffect(() => {
        if (!chartContainerRef.current) return;

        // Create chart
        chartRef.current = createChart(chartContainerRef.current, {
            width: chartContainerRef.current.clientWidth,
            height: 600
        });

        // Add series
        seriesRef.current = chartRef.current.addSeries(CandlestickSeries);
        seriesRef.current.setData(data);

        // Add indicators
        applySMA(seriesRef.current, chartRef.current, { period: 20 });
        applyRSI(seriesRef.current, chartRef.current, { period: 14 });

        // Cleanup
        return () => {
            if (chartRef.current) {
                chartRef.current.remove();
            }
        };
    }, []);

    // Update data when it changes
    useEffect(() => {
        if (seriesRef.current && data) {
            seriesRef.current.setData(data);
        }
    }, [data]);

    return <div ref={chartContainerRef} />;
}
Vue 3
<template>
  <div ref="chartContainer"></div>
</template>

<script setup>
import { ref, onMounted, onUnmounted, watch } from 'vue';
import { createChart, CandlestickSeries, applyMACD } from '@pipsend/charts';

const props = defineProps(['data']);
const chartContainer = ref(null);
let chart = null;
let series = null;

onMounted(() => {
    chart = createChart(chartContainer.value, {
        width: chartContainer.value.clientWidth,
        height: 600
    });

    series = chart.addSeries(CandlestickSeries);
    series.setData(props.data);

    // Add MACD
    applyMACD(series, chart, {
        fastPeriod: 12,
        slowPeriod: 26,
        signalPeriod: 9
    });
});

watch(() => props.data, (newData) => {
    if (series) {
        series.setData(newData);
    }
});

onUnmounted(() => {
    if (chart) {
        chart.remove();
    }
});
</script>
Angular
import { Component, ElementRef, Input, OnInit, OnDestroy, ViewChild } from '@angular/core';
import { createChart, CandlestickSeries, applyBollingerBands } from '@pipsend/charts';

@Component({
  selector: 'app-trading-chart',
  template: '<div #chartContainer></div>'
})
export class TradingChartComponent implements OnInit, OnDestroy {
  @ViewChild('chartContainer') chartContainer!: ElementRef;
  @Input() data: any[];

  private chart: any;
  private series: any;

  ngOnInit() {
    this.chart = createChart(this.chartContainer.nativeElement, {
      width: this.chartContainer.nativeElement.clientWidth,
      height: 600
    });

    this.series = this.chart.addSeries(CandlestickSeries);
    this.series.setData(this.data);

    // Add Bollinger Bands
    applyBollingerBands(this.series, this.chart, {
      period: 20,
      stdDev: 2
    });
  }

  ngOnDestroy() {
    if (this.chart) {
      this.chart.remove();
    }
  }
}
Svelte
<script>
    import { onMount, onDestroy } from 'svelte';
    import { createChart, CandlestickSeries, applyStochastic } from '@pipsend/charts';

    export let data;

    let chartContainer;
    let chart;
    let series;

    onMount(() => {
        chart = createChart(chartContainer, {
            width: chartContainer.clientWidth,
            height: 600
        });

        series = chart.addSeries(CandlestickSeries);
        series.setData(data);

        // Add Stochastic
        applyStochastic(series, chart, {
            kPeriod: 14,
            dPeriod: 3
        });
    });

    $: if (series && data) {
        series.setData(data);
    }

    onDestroy(() => {
        if (chart) {
            chart.remove();
        }
    });
</script>

<div bind:this={chartContainer}></div>
Vanilla JavaScript
import {
    createChart,
    CandlestickSeries,
    applySMA,
    applyRSI,
    createTradingLine
} from '@pipsend/charts';

// Create chart
const chart = createChart(document.getElementById('chart'), {
    width: 800,
    height: 600
});

// Add candlestick series
const series = chart.addSeries(CandlestickSeries);
series.setData(historicalData);

// Add indicators
applySMA(series, chart, { period: 50, color: '#FF6D00' });
applyRSI(series, chart, { period: 14 });

// Add trading lines
const stopLoss = createTradingLine(series, chart, {
    price: 95.00,
    type: 'stop-loss',
    onDragEnd: (price) => {
        document.getElementById('slPrice').textContent = price.toFixed(2);
    }
});
Server-side rendering
The library needs a browser (Canvas API). In frameworks that render on the server, such as Next.js, load the chart component on the client only:
const Chart = dynamic(() => import('./Chart'), { ssr: false });
Examples
Full trading chart
import {
    createChart,
    CandlestickSeries,
    applySMA,
    applyEMA,
    applyBollingerBands,
    applyRSI,
    applyMACD,
    applyVolume,
    setSeriesVolumes,
    createTradingLine,
    createInteractiveLineManager
} from '@pipsend/charts';

// Fetch data from your API
const response = await fetch('/api/ohlcv');
const data = await response.json();

// Create chart
const chart = createChart(document.getElementById('chart'), {
    width: window.innerWidth,
    height: 600,
    layout: {
        background: { color: '#1E222D' },
        textColor: '#DDD',
    },
});

// Add candlestick series
const series = chart.addSeries(CandlestickSeries, {
    upColor: '#26a69a',
    downColor: '#ef5350',
});
series.setData(data);

// Add moving averages
applySMA(series, chart, { period: 20, color: '#2196F3' });
applyEMA(series, chart, { period: 50, color: '#FF9800' });

// Add Bollinger Bands
applyBollingerBands(series, chart, { period: 20, stdDev: 2 });

// Add oscillators
applyRSI(series, chart, { period: 14, color: '#9C27B0' });
applyMACD(series, chart, { fastPeriod: 12, slowPeriod: 26, signalPeriod: 9 });

// Add volume (data: [{ time, open, high, low, close, volume }, ...])
setSeriesVolumes(series, data);
applyVolume(series, chart, { colorUp: '#26a69a', colorDown: '#ef5350' });

// Add trading lines
const currentPrice = data[data.length - 1].close;

const stopLoss = createTradingLine(series, chart, {
    price: currentPrice * 0.98,
    type: 'stop-loss',
    onDragEnd: async (price) => {
        await fetch('/api/orders/update', {
            method: 'POST',
            body: JSON.stringify({ stopLoss: price })
        });
    }
});

const takeProfit = createTradingLine(series, chart, {
    price: currentPrice * 1.05,
    type: 'take-profit',
    onDragEnd: async (price) => {
        await fetch('/api/orders/update', {
            method: 'POST',
            body: JSON.stringify({ takeProfit: price })
        });
    }
});

// Interactive line manager
const manager = createInteractiveLineManager(chart, series);

document.getElementById('addSL').onclick = async () => {
    const line = await manager.enableClickToCreate('stop-loss', {
        onDragEnd: (price) => console.log('SL:', price)
    });
};

// Responsive
window.addEventListener('resize', () => {
    chart.applyOptions({ width: window.innerWidth });
});
Position lines with BUY/SELL tags
From the library's trading UI example:
const { createChart, CandlestickSeries, createSeriesMarkers, createPositionLine, LineStyle } = PipsendCharts;

const markers = createSeriesMarkers(series, [
    { time: candles[40].time, position: 'belowBar', shape: 'tag', color: '#26a69a', text: 'BUY' },
    { time: candles[92].time, position: 'aboveBar', shape: 'tag', color: '#ef5350', text: 'SELL' },
]);

const entryPrice = candles[candles.length - 1].close;

const position = createPositionLine(series, chart, {
    entry: {
        price: entryPrice,
        badge: '1',
        formatText: () => '+ 2.32 USD',
    },
    takeProfit: {
        price: entryPrice + 43,
        badge: '1',
        lineStyle: LineStyle.Solid,
        formatText: (price) => `+ ${((price - entryPrice) * 1).toFixed(2)} USD`,
    },
    stopLoss: {
        price: entryPrice - 41,
        badge: '1',
        lineStyle: LineStyle.Solid,
        formatText: (price) => `- ${Math.abs((price - entryPrice)).toFixed(2)} USD`,
    },
    onDragEnd: (level, price) => console.log(level, 'moved to', price.toFixed(2)),
    onClose: (level) => console.log(level, 'closed'),
    onClick: (level) => console.log(level, 'clicked'),
});

position.applyOptions({ connectorVisible: false });   // hide the connector
Indicators with a toggle
const indicators = { sma: null, rsi: null };

function toggleSMA() {
    if (indicators.sma) {
        indicators.sma.remove();
        indicators.sma = null;
    } else {
        indicators.sma = applySMA(series, chart, { period: 20, color: '#2962FF', lineWidth: 2 });
    }
}

function toggleRSI() {
    if (indicators.rsi) {
        indicators.rsi.remove();
        indicators.rsi = null;
    } else {
        indicators.rsi = applyRSI(series, chart, { period: 14, color: '#9C27B0' });
    }
}
When the last series of an indicator pane is removed, the pane closes automatically.
Sample pages
The repository ships HTML examples that load the standalone build from a script tag: a gallery (index.html), one page per series type (line, area, bar, baseline, histogram), indicators.html, drawing-tools-showcase.html, trading-lines.html, trading-lines-advanced.html, position-tool-example.html, position-markers-example.html and modern-trading-ui.html. They are available in the GitHub repository.
Troubleshooting
The chart does not render
The container is empty or the chart does not appear.
// 1. Ensure the container has explicit dimensions
const container = document.getElementById('chart');
container.style.width = '800px';
container.style.height = '600px';

// 2. Wait for the DOM to be ready
document.addEventListener('DOMContentLoaded', () => {
    const chart = createChart(container);
});

// 3. Check that the container exists
if (!container) {
    console.error('Chart container not found!');
}
If nothing is drawn, also check that time is in seconds (not milliseconds) and that the data is sorted in ascending order.
An indicator draws nothing
- Arguments reversed. It is
apply*(series, chart), not(chart, series). The two primitive-based indicators (createTradingSessionsIndicator,createVolumeProfileIndicator) are the other way around:(chart, series). - Volume, OBV, MFI or VWAP are empty. Call
setSeriesVolumes(series, bars)first. - Volume Profile is empty. It uses
setVolumeProfileData(), notsetSeriesVolumes(). - The period is longer than the data. With 10 candles,
period: 20cannot produce a value. - Data format. Times must be strings (
YYYY-MM-DD) or timestamps, in a single form, ordered and unique. lineWidth: 5does nothing. Only 1, 2, 3 and 4 are accepted.
incorrect pane index
The engine does not leave gaps between panes. If you request pane 7 and only panes 0 and 1 exist, the series lands in pane 2, and configuring the scale of pane 7 throws this error. Ask the chart where the series ended up with series.getPane().paneIndex(). To move a series later, use series.moveToPane(i); applyOptions({ paneIndex }) on an indicator does not move it.
Ghost series after removing an indicator
You did not call remove() on the handle, so the subscription keeps writing. Always keep the handle and call remove().
Common data errors
| Symptom | Cause |
|---|---|
| Nothing is drawn | time in milliseconds, or unsorted data |
Cannot update oldest data |
update() with a time earlier than the last bar; use update(point, true) |
| Baseline all one color | baseValue left at the default 0 |
| Volume covers the price | Missing priceScaleId: '' and scaleMargins |
| Histogram all one color | The color goes on each point, not on the series options |
| The old series "comes back" after changing chart type | A stored reference to an already removed series |
Drawing tools
- Tool not drawing. Verify the chart and series are initialized, that the tool was added to the manager, and that
interactive: trueis set for user-drawn tools. - Cannot select or drag a tool. Make sure the tool is added to the manager, that no other tool is currently armed, and that mouse events are not blocked by an overlay.
- Tool disappears. Check that it was not removed, that its time and price are inside the visible range, and that you still hold a reference.
- Performance with many drawings. Reduce the number of active tools, and set
hoverable: falseon drawings nobody edits.
TypeScript
Import types explicitly and annotate:
import {
    createChart,
    CandlestickSeries,
    IChartApi,
    ISeriesApi,
    CandlestickData
} from '@pipsend/charts';

const chart: IChartApi = createChart(container);
const series: ISeriesApi<"Candlestick"> = chart.addSeries(CandlestickSeries);
Performance
- Limit the visible range with
chart.timeScale().setVisibleRange({ from, to })when working with very long histories. - Use
series.update()for live data and batch bursts of ticks. - Add indicators only when needed, and remove those you no longer show.
- Always ship the production build.
Module not found
Cannot find module '@pipsend/charts': reinstall the dependency and check it is listed in package.json.
rm -rf node_modules package-lock.json
npm install
npm list @pipsend/charts
For TypeScript, make sure moduleResolution is set so the package exports map is understood (for example "node16", "nodenext" or "bundler").
Exporting an image
Use chart.takeScreenshot(), which returns a canvas:
const canvas = chart.takeScreenshot();
const image = canvas.toDataURL('image/png');
Getting help
Open an issue on GitHub with your code snippet, the expected and actual behavior, your browser and library version, and any error messages.
License
Pipsend Charts is distributed under a dual-license model. The package.json license field reads SEE LICENSE IN LICENSE. This section summarizes the license files shipped with the package; it is not legal advice, and the license files themselves are the authoritative text.
Free license. The LICENSE file grants permission, free of charge, to any person or organization obtaining a copy of the software to use it, subject to these conditions.
Permitted uses:
- Use the software in personal projects (free).
- Use the software in commercial applications (free).
- Distribute the original, unmodified software.
- Include the software as a dependency in your projects.
- Use the software for educational purposes, and for research and development.
Restrictions:
- You may not modify, alter, or create derivative works of the software for the purpose of commercial distribution or sale.
- You may not sell, sublicense, or redistribute modified versions of the software for commercial purposes.
- You may not remove or alter any copyright notices, trademarks, or attribution from the software.
- You may not use the software's name, trademarks, or branding to endorse or promote derivative products without written permission.
Clarifications in the license: you can use the unmodified software in commercial applications for free, and you can make internal modifications for your own use (not for redistribution). You must include the license and copyright notice in all copies or substantial portions of the software.
Commercial license. A commercial license is required if you want to modify the software and distribute it commercially, create derivative works for commercial purposes, sell products based on modified versions, or redistribute modified versions under your own brand. The LICENSE-COMMERCIAL.md file describes the commercial offering, which it says includes full source code access, commercial redistribution rights, priority support, regular updates, and no attribution requirement ("Powered by Pipsend Charts" can be removed). To obtain one, contact licensing@pipsend.com.
Warranty. The software is provided "as is", without warranty of any kind, and the license limits liability as stated in the LICENSE file.
Third-party components. Pipsend Charts is based on TradingView's Lightweight Charts (copyright 2024 TradingView, Inc., Apache License 2.0) and uses fancy-canvas (ISC License). These components retain their original licenses.
Copyright notice:
Copyright (c) 2025 Pipsend
Based on TradingView's Lightweight Charts (Copyright 2024 TradingView, Inc.)