
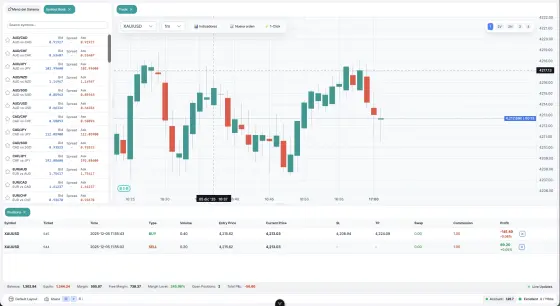
Advanced chart
A powerful chart with candles, intervals and styles that drops into any site and matches your brand.
42 widgets ready to embed with an iframe. Charts, markets, calendars, analysis and more, in your theme and language.
Show any symbol on any website.
A powerful chart with candles, intervals and styles that drops into any site and matches your brand.
A compact chart with the price and change of a symbol, ideal for sidebars and articles.
Compare the performance of up to 10 assets from any start date.
Where volume traded by price level, with the point of control highlighted.
An asset's average return by month of the year, to spot patterns that repeat.
Prices, changes and market leaders at a glance.
A configurable table of assets with price, percent change and a sparkline.
The day's biggest gainers and losers, with tabs to switch views.
A price tape that moves on its own.
A horizontal band of continuously moving prices for your site header.
Where money is flowing in and out.
The performance of each sector and its top stocks, sized by market cap.
Cryptocurrencies by market cap, colored by their change over the period.
Which countries and sectors are receiving inflows and which are seeing outflows.
A matrix with the exchange rate between the major currencies.
An ETF's composition and which stocks recently came in or went out.
Filter and spot opportunities automatically.
A configurable filter of stocks and crypto by price, volume and change.
Detects RSI, MACD and volume divergences across a configurable universe.
The full profile of an asset.
A symbol's card: price, range, volume and key data in one block.
Description, sector, headcount and corporate data for a company.
A company's financial metrics: revenue, margins, debt and valuation.
A buy, neutral or sell summary based on multiple indicators.
What moves the price, as it happens.
The news feed for a symbol or the market, with source and time.
Spots news that historically moved the price and alerts when a similar one arrives.
The latest insider buys and sells, with their track record.
Economic events, earnings and catalysts.
Macroeconomic events with impact, forecast and actual figure.
Company earnings release dates, with expected versus actual results and the time of each release.
Fed, ECB, expirations and earnings with a live countdown.
Fear, greed and market regime.
The sentiment from social networks, forums and news for an asset in a single 0 to 100 reading.
The fear and greed index for stocks, bitcoin, gold and forex at once.
Classifies the regime (risk-on, risk-off, stagflation) with a light and its rationale.
Flow, volatility and short interest.
Unusually large options trades, with filters by type, size and premium.
Calls and puts by strike and expiry, with price, volume and open interest.
Implied volatility by strike and expiry in a single chart.
Each stock's short interest and a proprietary squeeze-risk score.
Order book, DeFi and on-chain metrics.
Bids and asks by price level, in real time, with the spread and the depth of the market for a pair.
The liquidity of the main assets on centralized exchanges and DEXs, with their spread.
NVT, MVRV, net exchange flow, active whales and hash rate.
The value locked in the main DeFi protocols and how it changed.
Gold, silver and their context.
Gold, silver, platinum and palladium: spot vs futures, ratios, COT and ETF holdings.
The spot price of gold and silver with the ratio between them.
Correlations, position size and P&L.
Real-time correlation across stocks, gold, silver, bitcoin, oil, the dollar and volatility.
Calculates position size, money at risk and the risk to reward ratio.
Your portfolio result by asset, sector and asset class.
The full trading platform, embedded.
The Pipsend Web Trader inside your site, with the panels you choose.
We adapt them to your brand and data, or connect them to your own price feed.