

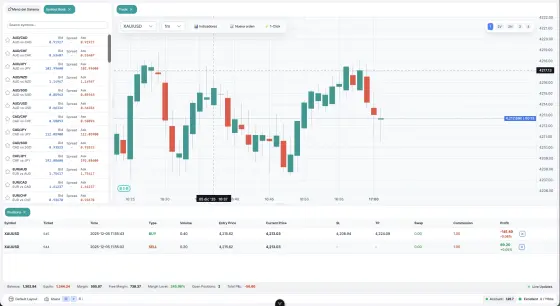
pipsend_charts is a charting package for Flutter trading apps. It renders interactive financial charts (candlesticks, OHLC bars, line and Heikin Ashi) with technical indicators, draggable trading lines, price zones, Fibonacci tools, drawing tools, a TradingView-style crosshair, replay mode and lazy loading of historical data.
This page documents package version 1.7.1.
Overview and requirements
Highlights
- Candlestick, OHLC bar, line and Heikin Ashi chart types
- Pinch-to-zoom, pan, vertical zoom/pan and drag-to-scale on the price axis
- 15 technical indicators (moving averages, oscillators, volatility, volume, sessions)
- Trading lines (entry, stop loss, take profit, alert, support, resistance) and price zones (supply, demand, support, resistance)
- Fibonacci retracement, extension and fan, trend lines, and eight more drawing tools, all draggable
- Managers with an event system and JSON serialization (
toJson/fromJson,serializeAll/restoreAll) - Configurable grid, adaptive labels, rounded candles, light and dark styling
- Infinite history (lazy loading) through
onXOffsetChanged - Replay mode with a draggable playhead and tick-by-tick animation
- Tap-to-select drawings, persistent crosshair and a drawing placement mode
Requirements
From the package pubspec.yaml:
| Requirement | Value |
|---|---|
| Dart SDK | >=2.15.0 <4.0.0 |
| Flutter | >=2.0.0 |
| Dependencies | intl (>=0.17.0 <0.21.0) |
The package is built for Flutter mobile apps (iOS and Android). Its README also lists Web, macOS, Windows and Linux as supported platforms.
Links
- Package: pub.dev/packages/pipsend_charts
- Source and issues: github.com/ArcaTechCo/PipsendChartsFl
- Example app: the
examplefolder of the repository
Installation
Add the dependency to your pubspec.yaml:
dependencies:
  pipsend_charts: ^1.7.1
Then run:
flutter pub get
Import the package. Everything documented on this page is exported from this single entry point:
import 'package:pipsend_charts/pipsend_charts.dart';
Quick start
Basic chart
import 'package:pipsend_charts/pipsend_charts.dart';

InteractiveChart(
  candles: candleData,
  style: ChartStyle(
    priceGainColor: Colors.green,
    priceLossColor: Colors.red,
  ),
)
InteractiveChart fills the space its parent gives it, so place it inside an Expanded, a SizedBox or a Scaffold body.
With indicators
InteractiveChart(
  candles: candleData,
  indicators: [
    RSIIndicator(period: 14),
    MACDIndicator(fastPeriod: 12, slowPeriod: 26, signalPeriod: 9),
    BollingerBandsIndicator(period: 20, stdDev: 2.0),
  ],
)
With trading lines
final lineManager = TradingLineManager();

// Add a stop loss
lineManager.addLine(TradingLine(
  id: 'sl_1',
  price: 150.0,
  type: TradingLineType.stopLoss,
  options: TradingLineOptions(
    title: 'Stop Loss',
    draggable: true,
    onPriceChanged: (newPrice) {
      lineManager.updateLinePrice('sl_1', newPrice);
    },
  ),
));

InteractiveChart(
  candles: candleData,
  overlays: lineManager.lines,
)
With price zones
final zoneManager = PriceZoneManager();

// Add a demand zone
zoneManager.addZone(PriceZone(
  id: 'demand_1',
  minPrice: 140.0,
  maxPrice: 145.0,
  type: PriceZoneType.demand,
  options: PriceZoneOptions(
    label: 'Demand Zone',
    draggable: true,
    onRangeChanged: (newMin, newMax, newStartTime, newEndTime) {
      zoneManager.updateZoneRange('demand_1', newMin, newMax,
          startTime: newStartTime, endTime: newEndTime);
    },
  ),
));

InteractiveChart(
  candles: candleData,
  overlays: zoneManager.zones,
)
Chart widget and parameters
InteractiveChart is a StatefulWidget. Only candles is required.
Data and view
| Parameter | Type | Default | Description |
|---|---|---|---|
candles |
List<CandleData> |
required | Full series, oldest first. Must contain at least 3 candles. |
initialVisibleCandleCount |
int |
90 |
Candles shown when the chart first opens. Must be 3 or more. |
style |
ChartStyle |
ChartStyle() |
Visual configuration. See Theming. |
indicators |
List<Indicator> |
[] |
Technical indicators. See Indicators. |
overlays |
List<ChartOverlay> |
[] |
Trading lines, zones and drawing tools. |
futureCandles |
int |
0 |
Empty candle-widths shown to the right of the last candle, so users can scroll into and draw in the future. A value of 50 gives roughly half a screen at default zoom. |
freeCamera |
bool |
false |
When true, scrolling is not constrained to the data range. |
initialVerticalZoom |
double |
1.0 |
1.0 fits candles to the height, above 1.0 adds padding above and below, below 1.0 crops. |
enableVerticalPan |
bool |
false |
Enables vertical zoom and pan. See Vertical zoom and pan. |
controller |
InteractiveChartController? |
null |
Programmatic control. See Controller and callbacks. |
showWatermark |
bool |
true |
Shows the Pipsend Charts logo in the bottom-left corner. |
Labels and info panel
| Parameter | Type | Description |
|---|---|---|
timeLabel |
TimeLabelGetter? |
String Function(int timestamp, int visibleDataCount). Formats the labels on the time axis. |
crosshairTimeLabel |
CrosshairTimeLabelGetter? |
String Function(int timestamp). Formats the date/time readout under the crosshair. Defaults to a locale-aware "EEE d MMM yy · HH:mm". |
priceLabel |
PriceLabelGetter? |
String Function(double price). Formats the price labels. Defaults to two decimals. |
overlayInfo |
OverlayInfoGetter? |
Map<String, String> Function(CandleData candle). Customizes the OHLC panel shown when the user touches the chart. |
Example of a custom info panel:
overlayInfo: (candle) => {
  "Date": "Customized date string goes here",
  "Open": candle.open?.toStringAsFixed(2) ?? "-",
  "Close": candle.close?.toStringAsFixed(2) ?? "-",
},
Interaction and callbacks
| Parameter | Type | Default | Description |
|---|---|---|---|
enableInteraction |
bool |
true |
Tap shows the candle details panel. Set to false for read-only or embedded charts. |
onTap |
ValueChanged<TapDetails>? |
null |
Fired when the user taps a candle. |
onCandleResize |
ValueChanged<double>? |
null |
Fired on zoom with the candle width at the current zoom level. |
onXOffsetChanged |
ValueChanged<XAxisOffsetDetails>? |
null |
Fired on pan or zoom. Used for infinite history. |
persistentCrosshair |
bool |
false |
Keeps the crosshair visible after the finger is lifted. Requires enableInteraction. |
onCrosshairActiveChanged |
ValueChanged<bool>? |
null |
Fired when a long-press toggles the crosshair. |
onOverlayTapped |
ValueChanged<ChartOverlay?>? |
null |
Fired with the tapped interactive overlay, or null for empty space. |
selectedOverlayId |
String? |
null |
Id of the overlay the host marks as selected. It is drawn with an emphasized border and handles. |
onSelectedOverlayRectChanged |
ValueChanged<Rect?>? |
null |
Reports the bounding rect of the selected overlay as the chart pans and zooms. Currently emitted for PriceZone overlays. |
placement |
DrawingPlacement? |
null |
Enters drawing placement mode. See Drawing placement mode. |
onPlacementComplete |
ValueChanged<List<PlacementPoint>>? |
null |
Fired when all placement points are confirmed. |
Replay
| Parameter | Type | Description |
|---|---|---|
playheadIndex |
int? |
Index of the last visible candle. null means no replay. Must satisfy 0 <= playheadIndex < candles.length. |
playheadTickProgress |
double? |
Sub-candle progress between 0.0 and 1.0. |
playheadStyle |
PlayheadStyle? |
Built-in playhead appearance. When null the playhead is not drawn. |
onPlayheadChanged |
ValueChanged<PlayheadInfo>? |
Fired when the user drags the built-in playhead. |
See Replay mode.
Data model
CandleData
CandleData(
  timestamp: DateTime.now().millisecondsSinceEpoch,
  open: 100.0,
  high: 105.0,
  low: 98.0,
  close: 103.0,
  volume: 1000000.0,
)
| Field | Type | Notes |
|---|---|---|
timestamp |
int |
Required. Milliseconds since epoch. |
open |
double? |
Required argument, may be null. A null open or close shows as a gap. |
close |
double? |
Required argument, may be null. |
volume |
double? |
Required argument, may be null. |
high |
double? |
Optional. If high or low is null, the wick is not drawn. |
low |
double? |
Optional. |
trends |
List<double?> |
Optional extra trend line values for this candle, for example [ma7, ma30]. The list is made unmodifiable, so assign a new list instead of mutating it. |
Keep the candles sorted from oldest to newest.
Helpers on CandleData
CandleData.computeMA(List<CandleData> data, [int period = 7])returns a list of moving average values (the firstperiodentries arenull) that you can assign totrends.CandleData.toHeikinAshi(List<CandleData> data)converts a full series to Heikin Ashi. It must run over the whole series because the Heikin Ashi open is recursive.CandleData.buildPartial(real, progress)returns an interpolated candle for tick replay.
Loading candles from an API
Future<List<CandleData>> loadCandles() async {
  final response = await http.get(Uri.parse('api-url'));
  final data = json.decode(response.body) as List;

  return data.map((item) => CandleData(
    timestamp: item['timestamp'],
    open: item['open'].toDouble(),
    high: item['high'].toDouble(),
    low: item['low'].toDouble(),
    close: item['close'].toDouble(),
    volume: item['volume']?.toDouble() ?? 0.0,
  )).toList();
}
TapDetails
Passed to onTap.
| Field | Type | Description |
|---|---|---|
candle |
CandleData? |
The tapped candle, or null when tapping the empty future space. |
tapPrice |
double |
Price at the tap position. |
candleIndex |
int |
Index of the tapped candle, or -1 in future space. |
timestamp |
int? |
Candle timestamp, or an extrapolated timestamp in future space. |
isFutureSpace |
bool (getter) |
true when candle is null. |
Real-time updates
InteractiveChart renders the list you pass in. To stream live data, update your list inside setState and give the chart a new list (or a new CandleData for the forming candle). CandleData fields are final, so replace the last element instead of editing it. The chart compares candles item by item, so rebuilding with identical instances does not trigger a repaint.
class RealtimeChart extends StatefulWidget {
  @override
  _RealtimeChartState createState() => _RealtimeChartState();
}

class _RealtimeChartState extends State<RealtimeChart> {
  List<CandleData> _data = [];
  final _controller = InteractiveChartController();
  bool _autoScroll = true;

  void _addNewCandle(CandleData newCandle) {
    setState(() {
      _data.add(newCandle);
    });

    // Auto-scroll to latest if enabled
    if (_autoScroll) {
      WidgetsBinding.instance.addPostFrameCallback((_) {
        _controller.jumpToLatest();
      });
    }
  }

  @override
  Widget build(BuildContext context) {
    return InteractiveChart(
      candles: _data,
      controller: _controller,
    );
  }
}
For a streaming source such as a WebSocket, see Integration guide.
Chart types
Select how the main price series is drawn with ChartStyle.chartType:
ChartType |
Description |
|---|---|
candlestick |
Japanese candlesticks. This is the default. |
bar |
OHLC bars: a vertical high/low line with a left tick at the open and a right tick at the close. |
line |
A single path through the closes. The price axis is bounded by the closes instead of the highs and lows. |
heikinAshi |
Heikin Ashi candles, derived internally and cached. |
InteractiveChart(
  candles: candleData,
  style: ChartStyle(
    chartType: ChartType.line,
    lineColor: Colors.blue,   // falls back to priceGainColor
    lineWidth: 1.6,           // default
  ),
)
With ChartType.heikinAshi, indicators, the price axis and the crosshair OHLC panel all report Heikin Ashi values. Overlays such as trading lines, zones and Fibonacci tools keep their real prices, so they sit on the Heikin Ashi axis rather than on the original candles.
Rounded candles
InteractiveChart(
  candles: candleData,
  style: ChartStyle(
    candleBorderRadius: 4.0,  // 0.0 = square, 8.0 = very rounded
    priceGainColor: Colors.green,
    priceLossColor: Colors.red,
  ),
)
candleBorderRadius only affects the candle body, not the wicks. Suggested values: 0.0 square (default), 2.0 slightly rounded, 4.0 moderately rounded, 8.0 very rounded.
Volume
Volume bars are shown by default. Control them with ChartStyle.showVolume, volumeColor and volumeHeightFactor (fraction of the chart height, default 0.2).
Indicators
Pass indicators with the indicators parameter. Every indicator accepts an optional id, panel, style and visible (default true). Indicators are cached; call clearCache() on an indicator to force a recalculation.
InteractiveChart(
  candles: data,
  indicators: [
    RSIIndicator(period: 14),
    MACDIndicator(
      fastPeriod: 12,
      slowPeriod: 26,
      signalPeriod: 9,
    ),
    BollingerBandsIndicator(
      period: 20,
      stdDev: 2.0,
    ),
    SMAIndicator(period: 20),
    EMAIndicator(period: 12),
  ],
)
Available indicators
| Indicator | Constructor parameters (defaults) | Style class | Default placement |
|---|---|---|---|
SMAIndicator |
period (20) |
SMAStyle |
Overlay |
EMAIndicator |
period (12) |
EMAStyle |
Overlay |
WMAIndicator |
period (20) |
WMAStyle |
Overlay |
BollingerBandsIndicator |
period (20), stdDev (2.0) |
BollingerBandsStyle |
Overlay |
FractalsIndicator |
none | FractalsStyle |
Overlay |
VolumeProfileIndicator |
bins (24), showPOC (true), showValueArea (true) |
VolumeProfileStyle |
Overlay (fixed) |
TradingSessionsIndicator |
none | TradingSessionsStyle |
Overlay (fixed) |
RSIIndicator |
period (14), overbought (70), oversold (30) |
RSIStyle |
Separate panel, height 0.2 |
MACDIndicator |
fastPeriod (12), slowPeriod (26), signalPeriod (9) |
MACDStyle |
Separate panel, height 0.25 |
StochasticIndicator |
kPeriod (14), dPeriod (3), overbought (80), oversold (20) |
StochasticStyle |
Separate panel, height 0.2 |
ATRIndicator |
period (14) |
ATRStyle |
Separate panel, height 0.15 |
ADXIndicator |
period (14) |
ADXStyle |
Separate panel, height 0.2 |
CCIIndicator |
period (20), overbought (100), oversold (-100) |
CCIStyle |
Separate panel, height 0.2 |
WilliamsRIndicator |
period (14), overbought (-20), oversold (-80) |
WilliamsRStyle |
Separate panel, height 0.2 |
OBVIndicator |
none | OBVStyle |
Separate panel, height 0.2 |
VolumeProfileIndicator and TradingSessionsIndicator do not accept a panel argument; they are always drawn over the main chart.
Panels
The panel parameter takes an IndicatorPanel:
IndicatorPanel.overlay({String? priceScaleId, bool showGrid = false})
IndicatorPanel.separate({
  double height = 0.2,
  String? priceScaleId,
  bool showGrid = true,
  bool showPriceScale = true,
})
Style examples
RSIIndicator(
  period: 14,                          // Default: 14
  style: RSIStyle(
    lineColor: Colors.purple,
    overboughtLevel: 70,
    oversoldLevel: 30,
  ),
)
MACDIndicator(
  fastPeriod: 12,
  slowPeriod: 26,
  signalPeriod: 9,
  style: MACDStyle(
    macdLineColor: Colors.blue,
    signalLineColor: Colors.orange,
    histogramPositiveColor: Colors.green,
    histogramNegativeColor: Colors.red,
  ),
)
BollingerBandsIndicator(
  period: 20,
  stdDev: 2.0,
  style: BollingerBandsStyle(
    upperBandColor: Colors.red,
    middleBandColor: Colors.blue,
    lowerBandColor: Colors.green,
  ),
)
Style fields
| Style class | Fields (defaults) |
|---|---|
SMAStyle |
lineColor (blue), lineWidth (2.0) |
EMAStyle |
lineColor (orange), lineWidth (2.0) |
WMAStyle |
lineColor (purple), lineWidth (2.0) |
ATRStyle |
lineColor (orange), lineWidth (2.0) |
RSIStyle |
lineColor, lineWidth (2.0), overboughtColor, oversoldColor, referenceLinesColor, overboughtLevel (70), oversoldLevel (30) |
MACDStyle |
macdLineColor, macdLineWidth, signalLineColor, signalLineWidth, histogramPositiveColor, histogramNegativeColor, zeroLineColor |
BollingerBandsStyle |
upperBandColor, upperBandWidth, middleBandColor, middleBandWidth, lowerBandColor, lowerBandWidth, fillBands (true), fillColor |
StochasticStyle |
kLineColor (blue), dLineColor (red), lineWidth, overboughtColor, oversoldColor |
ADXStyle |
adxLineColor (blue), plusDIColor (green), minusDIColor (red), lineWidth |
CCIStyle |
lineColor (purple), lineWidth, overboughtColor, oversoldColor, zeroLineColor |
WilliamsRStyle |
lineColor (teal), lineWidth, overboughtColor, oversoldColor |
OBVStyle |
lineColor (cyan), lineWidth, zeroLineColor |
FractalsStyle |
upColor, downColor, markerSize (6.0), markerGap (6.0) |
VolumeProfileStyle |
barColor, pocBarColor, pocLineColor, pocLineWidth, valueAreaColor, borderColor, labelColor, showLabels, widthFactor (0.15) |
TradingSessionsStyle |
showTokyo, showLondon, showNewYork, showLabels, tokyoColor, londonColor, newYorkColor, overlapColor, labelTextColor |
Drawing tools and gestures
All drawing tools are ChartOverlay objects. Pass them in the overlays list, either directly or through a manager. Every overlay has an id (optional in most constructors, but provide a unique one for drag and drop and serialization), a visible flag, and an options object that holds draggable and the callbacks.
The chart is fully controlled by your app. When the user drags an overlay, the chart calls the onMoved-style callback with the new coordinates. You then store the new values (directly or through a manager) and rebuild the chart.
Trading lines
Horizontal price levels.
TradingLine(
  id: 'sl_1',
  price: 150.0,
  type: TradingLineType.stopLoss,
  options: TradingLineOptions(title: 'Stop Loss', draggable: true),
)
TradingLine({String? id, required double price, required TradingLineType type, TradingLineStyle? style, TradingLineOptions? options, bool visible = true, int? startTime, int? endTime})
Types (TradingLineType):
entry- entry pointstopLoss- stop loss leveltakeProfit- take profit targetalert- alert level (dashed by default)support- support levelresistance- resistance levelcustom- custom line
TradingLineOptions (defaults): showLabel (true), showPrice (true), title, customText, customTextColor, customTextFontSize, customTextBackgroundColor, labelPosition (LabelPosition.left; also right, center, custom), customLabelOffset, priceFormatter, draggable (true), deletable (true), onTap, onPriceChanged, onPriceDragging, onDelete.
TradingLineStyle: color (required), lineWidth (1.0), dashPattern, labelColor, labelFontSize (10), labelHorizontalPadding (2), labelVerticalPadding (1), labelBackgroundColor, priceColor, priceFontSize (10), priceBackgroundColor. Factories: TradingLineStyle.fromType(type), .solid(color), .dashed(color), .dotted(color).
Passing startTime and endTime anchors the line to a time range. Without them the line extends across the whole chart. A line that has draggable: true or an onTap callback is interactive.
Manager (TradingLineManager):
// Add line
String? id = lineManager.addLine(line);

// Update price
lineManager.updateLinePrice(id, newPrice);

// Remove line
lineManager.removeLine(id);

// Query
List<TradingLine> lines = lineManager.getLinesByType(TradingLineType.stopLoss);

// Clear all
lineManager.clear();

// Listen to events
lineManager.addListener((event) {
  print('Line ${event.type}: ${event.line?.id}');
});
Other members include addLines, removeLines, getLineById, updateLine, setLineVisibility, toggleLineVisibility, visibleLines, stopLossLines, takeProfitLines, entryLines, alertLines, supportLines, resistanceLines, getLinesInRange, findClosestLine, clearByType, count, isEmpty, hasLine, and sorting helpers (sortByPrice, sortByType).
Price zones
Rectangular zones between two prices.
PriceZone({String? id, required double minPrice, required double maxPrice, required PriceZoneType type, PriceZoneStyle? style, PriceZoneOptions? options, bool visible = true, int? startTime, int? endTime})
Types (PriceZoneType): support, resistance, demand, supply, custom.
PriceZoneOptions: label, showLabel (true), draggable (false), resizable (false), onRangeChanged(minPrice, maxPrice, startTime, endTime), onDelete.
PriceZoneStyle: fillColor (required), borderColor, borderWidth (1.0), showBorder (true), labelStyle.
Zones support full 2D movement and corner-handle resizing. PriceZone.boundingRect(params) exposes the zone bounds.
Manager (PriceZoneManager):
// Add zone
String id = zoneManager.addZone(zone);

// Update range
zoneManager.updateZoneRange(id, newMin, newMax);

// Remove zone
zoneManager.removeZone(id);

// Query
List<PriceZone> zones = zoneManager.getZonesByType(PriceZoneType.demand);

// Clear all
zoneManager.clear();
Other members include addZones, getZoneById, updateZone, setZoneVisibility, toggleZoneVisibility, supportZones, resistanceZones, demandZones, supplyZones, getZonesAtPrice, getZonesInRange, findClosestZone, clearByType.
Fibonacci retracement
final fibManager = FibonacciManager();

fibManager.addFibonacci(FibonacciRetracement(
  id: 'fib_1',
  highPrice: 200.0,
  lowPrice: 150.0,
  options: FibonacciOptions(
    showLabels: true,
    showPercentages: true,
    draggable: true,
    onMoved: (newHigh, newLow, newStartTime, newEndTime) {
      fibManager.updateFibonacciRange('fib_1', newHigh, newLow,
          startTime: newStartTime, endTime: newEndTime);
    },
  ),
));

InteractiveChart(
  candles: candleData,
  overlays: fibManager.fibonaccis,
)
FibonacciRetracement({String? id, required double highPrice, required double lowPrice, FibonacciStyle? style, FibonacciOptions? options, bool visible = true, int? startTime, int? endTime})
FibonacciOptions (defaults): draggable (true), showLabels (true), showPercentages (true), showPrices (true), extendLines (false), onMoved, onDelete.
FibonacciStyle: level0Color, level236Color, level382Color, level50Color, level618Color, level786Color, level100Color, lineWidth, labelStyle.
Retracement supports full 2D dragging with top-left and bottom-right corner handles.
Fibonacci extension
Three-point projection (points A, B and C, each independently draggable). Levels: 0%, 38.2%, 61.8%, 100%, 127.2%, 161.8%, 200%, 261.8%.
FibonacciExtension({String? id, required double pointAPrice, required int pointATime, required double pointBPrice, required int pointBTime, required double pointCPrice, required int pointCTime, FibonacciStyle? style, FibonacciExtensionOptions? options, bool visible = true})
FibonacciExtensionOptions({draggable = true, showLabels = true, onMoved, onDelete}), where onMoved has the signature (int, double, int, double, int, double).
Fibonacci fan
Radial Fibonacci lines from a pivot point (levels 38.2%, 50%, 61.8%).
FibonacciFan({String? id, required double startPrice, required int startTime, required double endPrice, required int endTime, FibonacciStyle? style, FibonacciFanOptions? options, bool visible = true})
FibonacciFanOptions({draggable = true, showLabels = true, onMoved, onDelete}), where onMoved has the signature (int, double, int, double).
Trend lines
final trendManager = TrendLineManager();

trendManager.addTrendLine(TrendLine(
  id: 'trend_1',
  startTime: startTimestamp,
  startPrice: 100.0,
  endTime: endTimestamp,
  endPrice: 150.0,
  options: TrendLineOptions(
    draggable: true,
    showAngle: true,
    extendRight: false,
    onMoved: (newStartTime, newStartPrice, newEndTime, newEndPrice) {
      trendManager.updateTrendLinePoints('trend_1',
        startTime: newStartTime,
        startPrice: newStartPrice,
        endTime: newEndTime,
        endPrice: newEndPrice,
      );
    },
  ),
));

InteractiveChart(
  candles: candleData,
  overlays: trendManager.trendLines,
)
TrendLineOptions (defaults): draggable (true), extendRight (false), extendLeft (false), showAngle (false), onMoved, onDelete.
TrendLineStyle: color (blue), lineWidth (2.0), dashPattern (empty), labelStyle.
More drawing tools
These tools are standalone overlays. Group them with ChartDrawingManager if you want to serialize them. All options classes include draggable (default true); the callback argument lists are shown below.
| Tool | Constructor (required arguments) | onMoved / change callback |
|---|---|---|
PositionTool |
entryPrice, stopLossPrice, takeProfitPrice |
PositionToolOptions.onPositionChanged(double entry, double stopLoss, double takeProfit) |
RulerTool |
startTime, startPrice, endTime, endPrice |
(int startTime, double startPrice, int endTime, double endPrice) |
VerticalLine |
timestamp |
(int newTimestamp) |
ArrowTool |
startTime, startPrice, endTime, endPrice |
(int startTime, double startPrice, int endTime, double endPrice) |
CircleTool |
centerTime, centerPrice, radiusTime, radiusPrice |
(int centerTime, double centerPrice, int radiusTime, double radiusPrice) |
TextTool |
timestamp, price, text |
(int timestamp, double price) plus onEdit |
BrushTool |
points (List<BrushPoint>) |
(int timeOffset, double priceOffset) |
GanttTool |
startTime, endTime, price (optional height 5.0, label) |
(int startTime, int endTime, double price) |
Each constructor also takes an optional id, style, options and visible. Style and options classes follow the naming pattern <Tool>Style and <Tool>Options (for example ArrowToolStyle, RulerToolOptions).
Notes on individual tools:
- PositionTool: the position is treated as long when
entryPrice > stopLossPrice, and as short otherwise.PositionToolOptionshasshowLabels,showPriceInLabel,showRiskReward,showPositionZone(false) anddraggable. Entry, stop loss and take profit drag independently. - RulerTool: shows price difference, percentage, number of candles and elapsed time.
RulerToolOptionshasshowPrice,priceDecimals(2),showPercentage,showPips(false),pipMultiplier(10000),showTime. - VerticalLine:
VerticalLineOptionshaslabel,showLabel,labelPosition(VerticalLineLabelPosition.toporbottom). The default dash pattern is[5, 3]. - ArrowTool:
ArrowToolStylehascolor,strokeWidth,arrowheadSize(12.0),arrowheadAngle(30.0),fillArrowhead. - CircleTool:
CircleToolStylehascolor,strokeWidth,filled,fillColor,fillOpacity(0.2). Radii are separate for time and price, so it can form an ellipse. - TextTool: double-tap a text tool that has an
onEditcallback to edit it.onEditisFuture<String?> Function(String currentText)and returns the new text. Styling includestextColor,fontSize,fontWeight,fontStyle,horizontalAlignment(TextHorizontalAlignment),verticalAlignment(TextVerticalAlignment),showBackground,backgroundColor,padding,borderRadius,showBorder,borderColor,borderWidth. - BrushTool: draws predefined freehand strokes from
BrushPoint(timestamp:, price:)values with smooth curves. It is a visualization of strokes you supply, not a built-in freehand input mode. - GanttTool: a time-period bar at a price level, with
GanttToolStylefieldsfillColor,fillOpacity,borderColor,borderWidth,borderRadius,showLabel,labelColor,labelFontSize,labelBackground.
Example of a text annotation with editing:
TextTool(
  id: textId,
  timestamp: _candles[60].timestamp,
  price: _candles[60].close ?? 0,
  text: 'Important note',
  options: TextToolOptions(
    draggable: true,
    onMoved: (newTimestamp, newPrice) {
      setState(() {
        final index = _overlays.indexWhere((o) => o.id == textId);
        if (index >= 0) {
          _overlays[index] = (_overlays[index] as TextTool).copyWith(
            timestamp: newTimestamp,
            price: newPrice,
          );
        }
      });
    },
    onEdit: (currentText) async {
      final controller = TextEditingController(text: currentText);
      return showDialog<String>(
        context: context,
        builder: (context) => AlertDialog(
          title: Text('Edit text'),
          content: TextField(controller: controller, autofocus: true),
          actions: [
            TextButton(
              onPressed: () => Navigator.pop(context, null),
              child: Text('Cancel'),
            ),
            TextButton(
              onPressed: () => Navigator.pop(context, controller.text),
              child: Text('Save'),
            ),
          ],
        ),
      );
    },
  ),
)
Placing initial positions with OverlayHelper
OverlayHelper calculates sensible initial positions inside the visible price range. Each method returns a Map<String, double>.
// Fibonacci: 40% of the visible range, centered
final position = OverlayHelper.calculateFibonacciPosition(
  minPrice: minVisiblePrice,
  maxPrice: maxVisiblePrice,
  heightPercent: 0.4,  // 40% of visible range
  centerPercent: 0.5,  // Centered vertically
);

fibManager.addFibonacci(FibonacciRetracement(
  id: 'fib_1',
  highPrice: position['highPrice']!,
  lowPrice: position['lowPrice']!,
  options: FibonacciOptions(
    draggable: true,
    onMoved: (high, low, startTime, endTime) {
      fibManager.updateFibonacciRange('fib_1', high, low,
          startTime: startTime, endTime: endTime);
    },
  ),
));
Available methods: calculateTrendLinePosition, calculateFibonacciPosition, calculatePriceZonePosition and calculateTradingLinePrice. For a price zone, calculatePriceZonePosition returns minPrice and maxPrice. For a trend line it requires visibleCandleCount, minPrice, maxPrice, latestTimestamp and candleInterval, and returns startTime, endTime, startPrice and endPrice.
Tap-to-select drawings
Use onOverlayTapped, selectedOverlayId and onSelectedOverlayRectChanged to build a TradingView-style selection with a floating toolbar (delete, edit, and so on). onOverlayTapped fires with the tapped overlay, or null when the user taps empty chart space. ChartOverlay.selectionBounds(params) is implemented for price zones, trend lines, Fibonacci tools, arrows, rulers, circles, Gantt bars, text, vertical lines and position tools.
Drawing placement mode
Placement mode lets users create a drawing by placing its points with a live preview, like TradingView.
InteractiveChart(
  candles: candleData,
  placement: const DrawingPlacement(
    pointCount: 2,
    preview: PlacementPreviewShape.line,
  ),
  onPlacementComplete: (points) {
    // points[i].price, points[i].timestamp, points[i].localPosition
    // Build the real drawing from these points, then set placement to null.
  },
)
DrawingPlacement({int pointCount = 2, PlacementPreviewShape preview = PlacementPreviewShape.rectangle, Color color = Color(0xFF2962FF)}). PlacementPreviewShape is none, rectangle or line. While placement is active, pan, zoom and overlay editing are suspended and an interactive crosshair with a center dot is shown. Each placed point is returned as a PlacementPoint (price, timestamp, localPosition). Your app builds the final drawing and then clears placement.
Gestures
Chart
| Gesture | Action |
|---|---|
| Drag | Pan the chart horizontally |
| Pinch | Zoom |
| Tap on a candle | Select it and show the OHLC panel (when enableInteraction is true) |
| Long-press on empty chart | Toggle the crosshair (when onCrosshairActiveChanged is set) |
| Drag on the price scale (right side) with one finger | Scale the Y axis |
| Double-tap the price scale | Reset to auto-fit |
| Vertical drag | Pan vertically (when enableVerticalPan is true) |
Overlays
| Gesture | Action |
|---|---|
| Tap | Select (see onOverlayTapped) |
| Drag | Move the overlay |
| Drag a handle | Resize or move a single point |
Double-tap a TextTool |
Edit its text (when onEdit is set) |
On desktop and web, Shift + Scroll zooms vertically and Alt + Scroll pans vertically when enableVerticalPan is enabled.
Vertical zoom and pan
InteractiveChart(
  candles: candleData,
  enableVerticalPan: true,        // Enable vertical controls
  initialVerticalZoom: 1.3,       // 30% padding above/below
  overlays: [
    TradingLine(
      price: 1.2500,
      type: TradingLineType.takeProfit,
      options: TradingLineOptions(title: 'TP'),
    ),
  ],
)
Use this to leave room for TP/SL lines and indicators outside the candle range. Dragging on the price scale scales the Y axis even when enableVerticalPan is false.
Crosshair
InteractiveChart(
  candles: candleData,
  persistentCrosshair: true,
  onCrosshairActiveChanged: (active) => setState(() => _crosshairOn = active),
  style: ChartStyle(
    crosshairDashed: true,
    crosshairLabelColor: Colors.blueGrey,
  ),
)
- In persistent mode the crosshair is visible from the start at a resting position and moves by the finger's delta, rather than jumping to the touch point.
- Highlighted price (right) and date (bottom) labels follow the crosshair, and the crosshair continues into the empty space past the first and last candle.
- In persistent mode the floating OHLC panel is hidden.
ChartStyle.crosshairDasheddraws thin dashed lines on both axes (TradingView-style).crosshairLabelColorsets the label background; the text color is chosen automatically for contrast.- A long-press on empty chart toggles the crosshair. The host reflects the requested state back through
persistentCrosshair.
Infinite history (lazy loading)
Load older candles as the user scrolls, similar to TradingView.
class ChartScreen extends StatefulWidget {
  @override
  _ChartScreenState createState() => _ChartScreenState();
}

class _ChartScreenState extends State<ChartScreen> {
  List<CandleData> _candles = [];
  bool _isLoadingHistory = false;

  @override
  void initState() {
    super.initState();
    _loadInitialData();
  }

  Future<void> _loadInitialData() async {
    // Load initial 200 candles
    final data = await api.fetchCandles(limit: 200);
    setState(() => _candles = data);
  }

  Future<void> _loadMoreHistory() async {
    if (_isLoadingHistory || _candles.isEmpty) return;

    setState(() => _isLoadingHistory = true);

    // Get oldest timestamp
    final oldestTimestamp = _candles.first.timestamp;

    // Load 100 more historical candles
    final olderData = await api.fetchCandles(
      before: oldestTimestamp,
      limit: 100,
    );

    setState(() {
      // Prepend: Add to the beginning
      // Chart automatically maintains visual position
      _candles = [...olderData, ..._candles];
      _isLoadingHistory = false;
    });
  }

  @override
  Widget build(BuildContext context) {
    return InteractiveChart(
      candles: _candles,

      // Detect when user scrolls near the beginning
      onXOffsetChanged: (details) {
        // Load more when less than 50 candles before visible area
        if (details.isNearStart(50) && !_isLoadingHistory) {
          // Use Future.microtask to avoid setState during build
          Future.microtask(() => _loadMoreHistory());
        }
      },
    );
  }
}
(api.fetchCandles stands for your own data source.)
XAxisOffsetDetails passed to onXOffsetChanged:
| Member | Description |
|---|---|
offset |
Current X offset |
startCandleIndex, endCandleIndex |
Visible range |
totalCandles |
Total candles available |
visibleCandleCount |
endCandleIndex - startCandleIndex |
candlesBeforeVisible, candlesAfterVisible |
Candles outside the visible range |
isAtStart, isAtEnd |
Boundary checks |
isNearStart([threshold = 50]), isNearEnd([threshold = 50]) |
Threshold checks |
Bidirectional loading:
onXOffsetChanged: (details) {
  // Load historical data when scrolling left
  if (details.isNearStart(50) && !_isLoadingHistory) {
    Future.microtask(() => _loadMoreHistory());
  }

  // Load recent data when scrolling right
  if (details.isNearEnd(50) && !_isLoadingRecent) {
    Future.microtask(() => _loadMoreRecentData());
  }
}
Tips: prepend older data (oldest first) so the chart keeps its visual position, keep a loading flag to avoid duplicate requests, and defer setState with Future.microtask.
Replay mode
Render the chart as if frozen at any historical moment. Candles past the playhead are hidden, while indicators keep computing over the full series so their cache stays warm. The playhead can be dragged like a video scrubber, and tick replay smoothly interpolates the in-progress candle.
InteractiveChart(
  candles: candles,           // full history (load once, large buffer)
  playheadIndex: playhead,    // last visible candle
  playheadTickProgress: tick, // 0.0..1.0 - sub-candle for tick mode
  playheadStyle: const PlayheadStyle(
    lineColor: Colors.blueAccent,
    dimRightSide: true,       // translucent overlay over the "future"
    draggable: true,
  ),
  onPlayheadChanged: (info) {
    // Update your replay state with info.candleIndex / info.candleTimestamp
  },
  controller: replayController, // optional, for seekToIndex/seekToTimestamp
)
Key behaviors:
- The chart's effective length becomes
playheadIndex + 1. Pan and zoom limits,XAxisOffsetDetails.totalCandlesandjumpToLatest()all honor it. CandleData.buildPartial(real, progress)replaces the playhead candle for smooth tick animation whenplayheadTickProgressis set.- A single-finger drag on the playhead is consumed before pan and zoom. Pinch still zooms normally.
PlayheadInfohascandleIndex,candleTimestampandinterpolatedTimestamp.
PlayheadStyle (defaults): lineColor (0xFF3B82F6), lineWidth (1.5), dashPattern, showLabel (true), labelStyle, labelBackground, labelHorizontalPadding (6), labelVerticalPadding (3), draggable (true), hitRadius (12), dimRightSide (true), dimColor, dimOpacity (0.25), showDragHandles (true), handleSize (8).
A complete play/pause/speed/scrub example using a timer:
InteractiveChart(
  candles: _candles,
  controller: _controller,
  playheadIndex: _playhead,
  playheadTickProgress: _mode == _Mode.tick ? _tickProgress : null,
  playheadStyle: const PlayheadStyle(
    lineColor: Color(0xFF3B82F6),
    lineWidth: 1.5,
    dashPattern: [4, 3],
    dimRightSide: true,
    dimOpacity: 0.22,
  ),
  onPlayheadChanged: (info) {
    setState(() {
      _playhead = info.candleIndex;
      _tickProgress = 0.0;
    });
  },
  indicators: [
    SMAIndicator(period: 20),
    SMAIndicator(period: 50),
  ],
  futureCandles: 20,
  initialVisibleCandleCount: 60,
)
On every timer tick, advance _playhead (or _tickProgress in tick mode) inside setState, then call _controller.seekToIndex(_playhead) to keep the playhead in view ("follow mode").
Grid and labels
Grid
InteractiveChart(
  candles: data,
  style: ChartStyle(
    gridStyle: GridStyle.full,  // Show both horizontal and vertical
  ),
)
Custom grid:
InteractiveChart(
  candles: data,
  style: ChartStyle(
    gridStyle: GridStyle(
      // Horizontal (price) grid
      showHorizontalGrid: true,
      horizontalLineStyle: GridLineStyle.solid,
      horizontalStrokeWidth: 1.0,
      horizontalGridColor: Colors.grey.withOpacity(0.3),

      // Vertical (time) grid
      showVerticalGrid: true,
      verticalLineStyle: GridLineStyle.dashed,
      verticalStrokeWidth: 0.5,
      verticalGridColor: Colors.grey.withOpacity(0.1),
    ),
  ),
)
GridStyle defaults: horizontal grid on, vertical grid off, color grey at 30% opacity, stroke width 0.5, GridLineStyle.solid.
Presets:
GridStyle.none          // No grid lines
GridStyle.horizontalOnly // Only horizontal (default)
GridStyle.full          // Both horizontal and vertical
GridStyle.subtle        // Low opacity (10%)
GridStyle.dashed        // Dashed style
GridStyle.dotted        // Dotted style
Line styles (GridLineStyle): solid, dashed, dotted, longDashed.
Adaptive labels
Labels adjust to the chart size by default:
InteractiveChart(
  candles: data,
  style: ChartStyle(
    adaptiveLabels: true,  // Default - auto-adjusts
  ),
)
- Price labels: about one label per 55 px of chart height, between 3 and 20.
- Time labels: spacing of 90 px by default.
- Grid alignment: grid lines always align with the labels.
Manual override:
InteractiveChart(
  candles: data,
  style: ChartStyle(
    adaptiveLabels: false,
    priceLabelCount: 7,      // Force 7 price labels
    timeLabelDensity: 100,   // One time label every 100px
  ),
)
priceLabelCount is clamped to 3-20 and timeLabelDensity to 60-120 pixels.
Theming
Styling is done with ChartStyle. There are no built-in dark() or light() constructors, so build a style for each theme. ChartStyle has no background color field; set the background on the parent widget (for example a Container or the Scaffold).
ChartStyle(
  // Candle appearance
  candleBorderRadius: 4.0,
  priceGainColor: Colors.green,
  priceLossColor: Colors.red,

  // Volume
  showVolume: true,
  volumeColor: Colors.grey,
  volumeHeightFactor: 0.2,

  // Grid
  gridStyle: GridStyle.subtle,

  // Labels
  priceLabelStyle: TextStyle(color: Colors.white, fontSize: 12),
  timeLabelStyle: TextStyle(color: Colors.white, fontSize: 12),

  // Selection
  selectionHighlightColor: Colors.blue.withOpacity(0.2),
)
ChartStyle reference
| Field | Default |
|---|---|
volumeHeightFactor |
0.2 |
priceLabelWidth |
48.0 |
timeLabelHeight |
24.0 |
timeLabelStyle |
TextStyle(fontSize: 16, color: Colors.grey) |
priceLabelStyle |
TextStyle(fontSize: 12, color: Colors.grey) |
overlayTextStyle |
TextStyle(fontSize: 16, color: Colors.white) |
chartType |
ChartType.candlestick |
lineWidth |
1.6 |
lineColor |
null (uses priceGainColor) |
priceGainColor |
Colors.green |
priceLossColor |
Colors.red |
showVolume |
true |
volumeColor |
Colors.grey |
trendLineStyles |
[] (list of Paint for CandleData.trends) |
gridStyle |
GridStyle() |
selectionHighlightColor |
Color(0x33757575) |
crosshairLabelColor |
null (opaque version of selectionHighlightColor) |
crosshairDashed |
false |
overlayBackgroundColor |
Color(0xEE757575) |
candleBorderRadius |
0.0 |
adaptiveLabels |
true |
priceLabelCount |
null |
timeLabelDensity |
null |
priceGridLineColor is deprecated; use gridStyle.horizontalGridColor. ChartStyle and PlayheadStyle compare by value, so an unchanged style does not cause a repaint.
Dark theme example
Container(
  color: const Color(0xFF131722),
  child: InteractiveChart(
    candles: candleData,
    style: ChartStyle(
      priceGainColor: const Color(0xFF26A69A),
      priceLossColor: const Color(0xFFEF5350),
      volumeColor: const Color(0xFF26A69A).withOpacity(0.3),
      timeLabelHeight: 32,
      priceLabelWidth: 60,
      overlayBackgroundColor: const Color(0xFF1E222D),
      overlayTextStyle: const TextStyle(color: Colors.white),
      selectionHighlightColor: Colors.blue.withOpacity(0.2),
    ),
  ),
)
Overlay and indicator styles
Each indicator and overlay has its own style class: RSIStyle, MACDStyle, BollingerBandsStyle, StochasticStyle, ATRStyle and so on for indicators; TradingLineStyle, PriceZoneStyle, FibonacciStyle and TrendLineStyle for overlays.
Controller and callbacks
InteractiveChartController
Create one controller, pass it to the chart, and keep it in your State.
class ControlledChart extends StatefulWidget {
  @override
  _ControlledChartState createState() => _ControlledChartState();
}

class _ControlledChartState extends State<ControlledChart> {
  final _controller = InteractiveChartController();

  @override
  Widget build(BuildContext context) {
    return Column(
      children: [
        ElevatedButton(
          onPressed: () => _controller.jumpToLatest(),
          child: Text('Jump to Latest'),
        ),
        Expanded(
          child: InteractiveChart(
            candles: data,
            controller: _controller,
          ),
        ),
      ],
    );
  }
}
| Member | Description |
|---|---|
jumpToLatest() |
Scrolls to the most recent candle. |
seekToIndex(int candleIndex) |
Centers the visible range on a candle index (clamped; in replay mode the upper bound is playheadIndex). |
seekToTimestamp(int timestamp) |
Centers on the candle with the closest timestamp not exceeding the given one. |
setVisibleCandleCount(int count) |
Zooms: higher values zoom out, lower values zoom in. |
isAttached |
true when the controller is attached to a chart. |
The seek methods and setVisibleCandleCount do nothing if the controller is not attached.
Manager events
All managers support event listeners. Each event carries a type, and the trading line event also has a nullable line:
// Trading Lines
lineManager.addListener((event) {
  switch (event.type) {
    case TradingLineEventType.added:
      print('Line added: ${event.line?.id}');
      break;
    case TradingLineEventType.priceChanged:
      print('Price changed: ${event.line?.price}');
      break;
    case TradingLineEventType.removed:
      print('Line removed');
      break;
    default:
      break;
  }
});

// Price Zones
zoneManager.addListener((event) {
  print('Zone event: ${event.type}');
});

// Fibonacci
fibManager.addListener((event) {
  print('Fibonacci event: ${event.type}');
});

// Trend Lines
trendLineManager.addListener((event) {
  print('Trend line event: ${event.type}');
});
Event types:
TradingLineEventType:added,removed,priceChanged,visibilityChanged,styleChanged,updated,clearedFibonacciEventType:added,removed,rangeChanged,visibilityChanged,styleChanged,updated,clearedTrendLineEventType:added,removed,pointsChanged,visibilityChanged,styleChanged,updated,cleared
Each manager has addListener, removeListener and clearListeners. Remove listeners in dispose().
Serialization and syncing
Every overlay (and its style and options) provides toJson() / fromJson(). Each manager provides serializeAll() and restoreAll(). ChartDrawingManager combines the four managers with the standalone tools:
final drawings = ChartDrawingManager();

drawings.onDrawingChanged = (type, id, serialized) {
  // Send to your backend or another device
};

final json = drawings.serializeAll();   // Map<String, dynamic>
drawings.restoreAll(json);
ChartDrawingManager exposes tradingLineManager, priceZoneManager, fibonacciManager and trendLineManager, plus add... / remove... methods for VerticalLine, TextTool, BrushTool, ArrowTool, CircleTool, RulerTool, GanttTool, PositionTool, FibonacciExtension and FibonacciFan, and clearAll(), totalCount, isEmpty and isNotEmpty.
Integration guide
Recommended structure for a trading app
- Keep the candle list and a controller in your
State(or in your state-management layer). - Keep one manager per drawing family (
TradingLineManager,PriceZoneManager, and so on), or a singleChartDrawingManager. - Pass
[...lineManager.lines, ...zoneManager.zones]asoverlays. - In each overlay callback (
onPriceChanged,onRangeChanged,onMoved), update the manager and callsetState. Persist the result to your backend if needed. - Use unique ids such as
'tool_${DateTime.now().millisecondsSinceEpoch}'.
class _CompleteChartState extends State<CompleteChart> {
  final List<CandleData> _data = [];
  final TradingLineManager _lineManager = TradingLineManager();
  final PriceZoneManager _zoneManager = PriceZoneManager();

  bool _showRSI = true;
  bool _showMACD = false;

  @override
  void initState() {
    super.initState();
    _lineManager.addListener((event) => setState(() {}));
    _zoneManager.addListener((event) => setState(() {}));
  }

  @override
  Widget build(BuildContext context) {
    return Scaffold(
      body: InteractiveChart(
        candles: _data,
        indicators: [
          if (_showRSI) RSIIndicator(period: 14),
          if (_showMACD) MACDIndicator(
            fastPeriod: 12,
            slowPeriod: 26,
            signalPeriod: 9,
          ),
        ],
        overlays: [
          ..._lineManager.lines,
          ..._zoneManager.zones,
        ],
        style: ChartStyle(
          priceGainColor: Colors.green,
          priceLossColor: Colors.red,
        ),
      ),
    );
  }

  @override
  void dispose() {
    _lineManager.clearListeners();
    _zoneManager.clearListeners();
    super.dispose();
  }
}
Overlay update rule
An overlay that did not change should keep its instance, and a changed overlay must be a new instance. TradingLine is immutable, so build a new line (or use the manager's updateLinePrice / updateLine) whenever its text or price changes. The chart compares overlays and indicators by identity, item by item, which keeps repaints cheap when you rebuild with the same instances.
Showing orders and positions
Use TradingLine with TradingLineType.entry, stopLoss and takeProfit for open orders, and PositionTool for a combined entry/SL/TP view. Pass an onTap to a non-draggable entry line to let users select the position on the chart.
TradingLine(
  id: 'entry_1',
  price: 150.0,
  type: TradingLineType.entry,
  options: TradingLineOptions(
    title: 'Entry',
    draggable: false,
    onTap: () {
      // Select the position in your UI
    },
  ),
)
Streaming data over a WebSocket
The package does not include a network layer. Feed your own stream into the candle list. The sketch below uses the web_socket_channel package and assumes a feed that sends the current candle as JSON; adapt the URL and field names to your provider.
import 'dart:convert';
import 'package:web_socket_channel/web_socket_channel.dart';

class LiveChart extends StatefulWidget {
  const LiveChart({super.key});

  @override
  State<LiveChart> createState() => _LiveChartState();
}

class _LiveChartState extends State<LiveChart> {
  final List<CandleData> _candles = []; // seed with historical candles first
  final _controller = InteractiveChartController();
  late final WebSocketChannel _channel;

  @override
  void initState() {
    super.initState();
    _channel = WebSocketChannel.connect(Uri.parse('wss://your-feed.example/candles'));
    _channel.stream.listen((message) {
      final m = json.decode(message as String);
      final candle = CandleData(
        timestamp: m['timestamp'],
        open: (m['open'] as num).toDouble(),
        high: (m['high'] as num).toDouble(),
        low: (m['low'] as num).toDouble(),
        close: (m['close'] as num).toDouble(),
        volume: (m['volume'] as num).toDouble(),
      );
      setState(() {
        if (_candles.isNotEmpty && _candles.last.timestamp == candle.timestamp) {
          _candles[_candles.length - 1] = candle; // update the forming candle
        } else {
          _candles.add(candle);                    // a new candle started
        }
      });
    });
  }

  @override
  void dispose() {
    _channel.sink.close();
    super.dispose();
  }

  @override
  Widget build(BuildContext context) {
    return InteractiveChart(
      candles: List.of(_candles),
      controller: _controller,
    );
  }
}
Handle reconnects, ordering and gaps in your own code, and validate data before building candles (for example, prices greater than zero and timestamps increasing).
Best practices
- Always call
setStateafter manager updates, and clear listeners indispose(). - Use unique ids for overlays.
- Limit the number of visible overlays (fewer than 50 is a good target) and use
visible: falseto hide instead of removing. - Keep the candle window reasonable (the implementation guide suggests a maximum of about 500 candles loaded at once) and use infinite history for older data.
- Set
enableInteraction: falsefor read-only or embedded charts, or when showing many charts at once. - Handle errors when loading data.
Migration from earlier versions
Upgrading to 1.7.1
1.7.1 is a performance release. No public API was removed or made required, and charts written for 1.7.0 render identically. Notable behavior changes: trading line text layout is cached, far off-screen lines are culled, repaints compare items by identity, and ChartStyle and PlayheadStyle compare by value.
Versions 1.3.0 to 1.7.0
These releases are additive (new parameters default to null or false):
- 1.7.0:
ChartTypeandChartStyle.chartType,lineColor,lineWidth, Heikin Ashi. - 1.6.0:
onOverlayTapped,selectedOverlayId,onSelectedOverlayRectChanged, crosshair beyond the data,FractalsIndicator. - 1.5.0: always-on crosshair,
crosshairTimeLabel,onCrosshairActiveChanged,placement/onPlacementComplete, price-axis scaling, denser price labels (about 55 px, up to 20). - 1.4.0: replay mode. This version changed
InteractiveChartController.attach(...)to named parameters; this only affects code that implements or callsattachitself. - 1.3.0:
persistentCrosshairandChartStyle.crosshairDashed.
Upgrading to 1.2.0 (breaking changes)
FibonacciOptions.onMovedchanged from(double, double)to(double, double, int?, int?), addingstartTimeandendTime.PriceZoneOptions.onRangeChangedchanged from(double, double)to(double, double, int?, int?).TapDetails.candleis now nullable (CandleData?) and isnullwhen tapping the future space.
New in 1.2.0: JSON serialization on all overlays, serializeAll() / restoreAll() on managers, ChartDrawingManager, onDrawingChanged, the futureCandles parameter, TapDetails.timestamp and TapDetails.isFutureSpace.
Upgrading from 1.0.5 to 1.0.6 (grid)
ChartStyle.priceGridLineColor is deprecated. It still works but shows a deprecation warning.
// Before
InteractiveChart(
  candles: data,
  style: ChartStyle(
    priceGridLineColor: Colors.grey,  // Deprecated
  ),
)

// After
InteractiveChart(
  candles: data,
  style: ChartStyle(
    gridStyle: GridStyle(
      showHorizontalGrid: true,
      horizontalGridColor: Colors.grey.withOpacity(0.3),
    ),
  ),
)
Upgrading from 1.0.3 to 1.0.4 (timestamp anchoring)
1.0.4 added optional startTime and endTime to TradingLine, PriceZone and FibonacciRetracement. This is backward compatible and fixes overlays that "stuck" to the viewport when scrolling.
TradingLine(
  price: 150.0,
  type: TradingLineType.stopLoss,
  startTime: startTimestamp,  // optional
  endTime: endTimestamp,      // optional
  options: TradingLineOptions(
    title: 'Stop Loss',
    draggable: true,
  ),
)
Without timestamps an overlay extends across the whole chart (the legacy behavior). Recommended: assign timestamps to overlays drawn by users, and omit them for global levels such as a global stop loss.
Upgrading from the interactive_chart package or 1.0.0
Version 1.0.0 rebranded the project from interactive_chart. Manager classes require event listeners for drag and drop, and overlay ids must be provided for drag and drop to work.
Examples
The repository includes a tabbed example app:
cd example
flutter run
The example contains tabs for:
- Indicators with toggles
- Trading lines
- Price zones
- Drawing tools (Fibonacci, trend lines and the other tools)
- Vertical zoom
- Infinite history (bidirectional lazy loading)
- Replay (play, pause, speed, scrub, bar and tick modes)
- Settings (grid, labels and candle controls)
Source files: example/lib/tabbed_example.dart, replay_example.dart, infinite_history_example.dart and vertical_zoom_example.dart.
Complete minimal page
import 'package:flutter/material.dart';
import 'package:pipsend_charts/pipsend_charts.dart';

class BasicChart extends StatelessWidget {
  final List<CandleData> data = [
    CandleData(
      timestamp: DateTime.now().millisecondsSinceEpoch,
      open: 100.0,
      high: 105.0,
      low: 98.0,
      close: 103.0,
      volume: 1000000.0,
    ),
    // Add more candles (at least 3 are required)...
  ];

  @override
  Widget build(BuildContext context) {
    return InteractiveChart(
      candles: data,
      style: ChartStyle(
        priceGainColor: Colors.green,
        priceLossColor: Colors.red,
      ),
    );
  }
}
Troubleshooting
The chart throws an assertion on startup
InteractiveChart requires at least 3 candles, and initialVisibleCandleCount must be 3 or more. Show a loading state until your data has arrived. If you use replay, playheadIndex must be a valid index into candles and playheadTickProgress must be between 0 and 1.
An overlay does not move
Check that:
draggable: trueis set in the options.- The change callback (
onMoved,onPriceChanged,onRangeChanged) is implemented and stores the new values. setState()is called after the update, or the manager listener triggers a rebuild.- The overlay has a unique
id.
Overlays disappear or look wrong after a callback signature change
Since 1.2.0, FibonacciOptions.onMoved and PriceZoneOptions.onRangeChanged take four arguments (..., int? startTime, int? endTime). Update old two-argument callbacks.
Text tool cannot be edited
Make sure onEdit is implemented, that the second tap arrives in under 300 ms, and that the callback returns the new text (or null to cancel).
Grid lines are not visible
gridStyle: GridStyle(
  showHorizontalGrid: true,  // must be true
  showVerticalGrid: true,    // must be true
)
Increase the color opacity (for example Colors.grey.withOpacity(0.5)) or the stroke width, and make sure the color contrasts with your background.
Too many or too few labels
Set adaptiveLabels: false and choose priceLabelCount (3-20) and timeLabelDensity (60-120).
"setState() or markNeedsBuild() called during build"
This happens when onXOffsetChanged calls setState directly. Defer it:
onXOffsetChanged: (details) {
  if (details.isNearStart(50)) {
    Future.microtask(() => _loadMoreHistory());
  }
}
The chart jumps when loading history
Prepend older candles (oldest first) instead of appending them:
_candles = [...newHistoricalData, ..._candles];
Several history requests fire at once
Use a loading flag:
bool _isLoading = false;

Future<void> _loadMoreHistory() async {
  if (_isLoading) return;
  setState(() => _isLoading = true);
  try {
    // Load data
  } finally {
    setState(() => _isLoading = false);
  }
}
Heikin Ashi overlays look off the candles
This is expected. Overlays keep their real prices, so with ChartType.heikinAshi they sit on the Heikin Ashi axis rather than on the original candles.
Getting help
Open an issue or start a discussion on GitHub.
License
Pipsend Charts Flutter is distributed under a dual license. This section summarizes the LICENSE and COMMERCIAL_LICENSE.md files in the repository; it is not legal advice. Read the original files before relying on any term.
Free license
The LICENSE file ("Pipsend Charts Flutter License", copyright 2025 Pipsend) grants permission "free of charge, to any person or organization" to use the software, subject to conditions.
Permitted uses:
- Use in personal projects (free)
- Use in commercial applications (free)
- Distribute the original, unmodified software
- Include the software as a dependency in your projects
- Educational use, research and development
Restrictions:
- You may not "modify, alter, or create derivative works of this Software for the purpose of commercial distribution or sale".
- You may not "sell, sublicense, or redistribute modified versions of this Software for commercial purposes".
- You may not remove or alter copyright notices, trademarks or attribution.
- You may not use the software's name, trademarks or branding to endorse or promote derivative products without written permission.
Clarifications in the file: you can use the unmodified software in commercial applications for free, and you can make internal modifications for your own use (not for redistribution), but you cannot sell or redistribute modified versions commercially. The license and copyright notice must be included in all copies or substantial portions of the software.
Commercial license
A commercial license is required if you want to modify the software and distribute it commercially, create derivative works for commercial purposes, sell products based on modified versions, or redistribute modified versions under your own brand. COMMERCIAL_LICENSE.md lists these tiers:
| Tier | Price | Summary |
|---|---|---|
| Startup | $499 USD / year | Up to 5 developers, 1 commercial product, email support, 1 year of updates |
| Business | $1,999 USD / year | Up to 25 developers, up to 5 commercial products, priority email support, 1 year of updates |
| Enterprise | $4,999 USD / year | Unlimited developers and products, white-label and OEM rights, priority support, 1 year of updates |
| Perpetual | Contact for pricing | One-time payment, perpetual modification rights |
Per that file, you do not need a commercial license to use the unmodified library in a commercial app (including App Store and Play Store apps), for internal modifications, for personal projects, or for educational use. The file states that licenses are per organization, not per developer, and that final terms are provided upon purchase. To obtain a commercial license, contact Pipsend through pipsend.com.
Third-party component
The package is based on interactive_chart by Mehdi Zarepour (MIT License, copyright 2021). That component retains its original MIT license, which the LICENSE file reproduces.
Warranty
The software is provided "as is", without warranty of any kind, and Pipsend and its contributors disclaim liability as set out in the LICENSE file.